H2O2 Solution Concentration Ratio, Condensation Point & Maximum Achievable vH2O2
This blog is the second in a 4-part series where we describe how process parameters influence condensation and the maximum achievable concentration of hydrogen peroxide vapor ppm during bio-decontamination applications. (Read the first blog on humidity.)
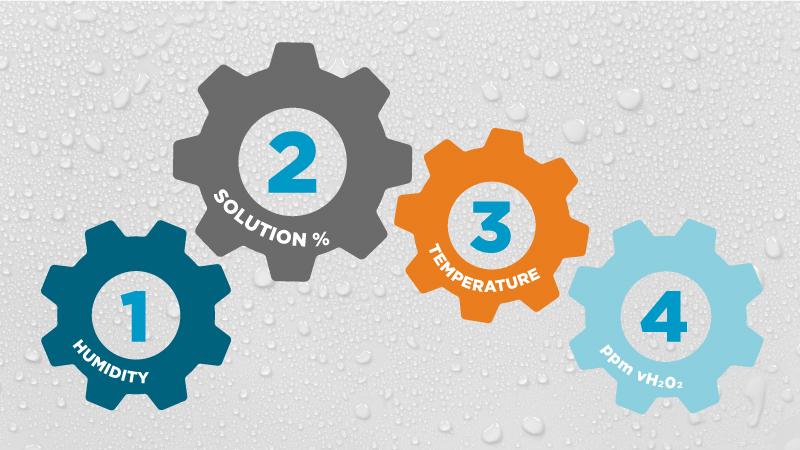
In this series we propose four basic process parameter rules. This blog focuses on the second rule:
A higher concentration H2O2 solution increases the H2O2 vapor that can be used before condensation.
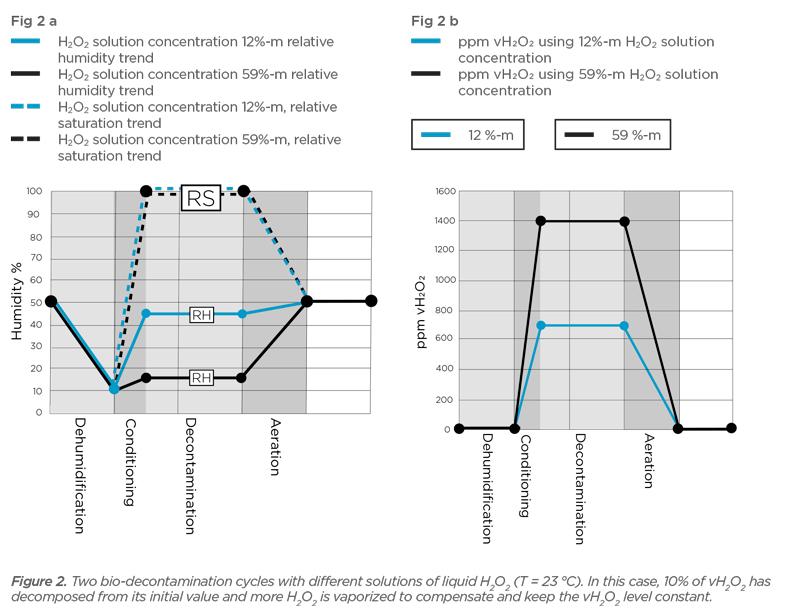
To illustrate this rule, we have the following graphs (Fig. 2a and 2b from the white paper on this topic). The graphs show two similar bio-decontamination cycles. Both cycles have temperature at 23 °C and initial relative humidity levels at 50% RH, dehumidified to 10% RH prior to conditioning.
The difference in the processes is in the H2O2 solution used. In the graphs, the blue lines represent bio-decontamination performed using an aqueous solution ratio of 12% H2O2 to 88% H2O. The black lines represent bio-decontamination using a solution ratio of 59%-m H2O2 to 41% H2O.
During conditioning, vaporized H2O2 is injected into the chamber until condensation is achieved. For the purpose of creating realistic cycles in the graphs, we presume that 10% of vH2O2 has decomposed from its initial value and more vaporized H2O2 is injected during bio-decontamination to compensate for decomposition.
Because the lower concentration solution (12%-m) contains 88% water, the chamber reaches 100% relative saturation faster than the chamber injected with the higher concentration (59%-m) solution. (Learn about relative saturation RS.)
It's important to understand that once RS is 100% and condensation is achieved, the level of vH2O2 ppm can no longer increase. Shown below, the maximum achievable vH2O2 concentration with the 59%-m solution is 1400 ppm prior to condensation. The maximum achievable vH2O2 concentration with the 12%-m solution is 700 ppm.
Part of vH2O2 cycle development is determining the level of vH2O2 that will generate a sufficient log kill. We hope that by understanding how the solution ratio affects both the condensation point (100%RS) and the achievable vH2O2 ppm, you can optimize your cycle development and ensure repeatable bio-decontamination processes.
Third blog: Temperature, Condensation Point & Maximum Achievable vH2O2 ppm in Bio-decontamination
Read about all four rules in the white paper: Considering Condensation: Influences in Hydrogen Peroxide Vapor Bio-decontamination.
We invite you to view a recorded webinar on this topic.
Please feel free to add comments and questions in the fields below, or contact us.
Add new comment