See how Vaisala Xweather is supercharging renewable energy
Weather is the fuel for renewable energy. That’s why accurate weather forecasts are essential to asset owners, project managers, energy traders, and power schedulers. Our customers need weather intelligence to schedule, buy, and sell with confidence, which requires forecasts not only for individual wind and solar projects but across vast geographic regions too.
Today, I’d like to introduce you to our new, enhanced Situational Awareness tool for renewable energy, part of our Vaisala Xweather suite of environmental data and mapping solutions.
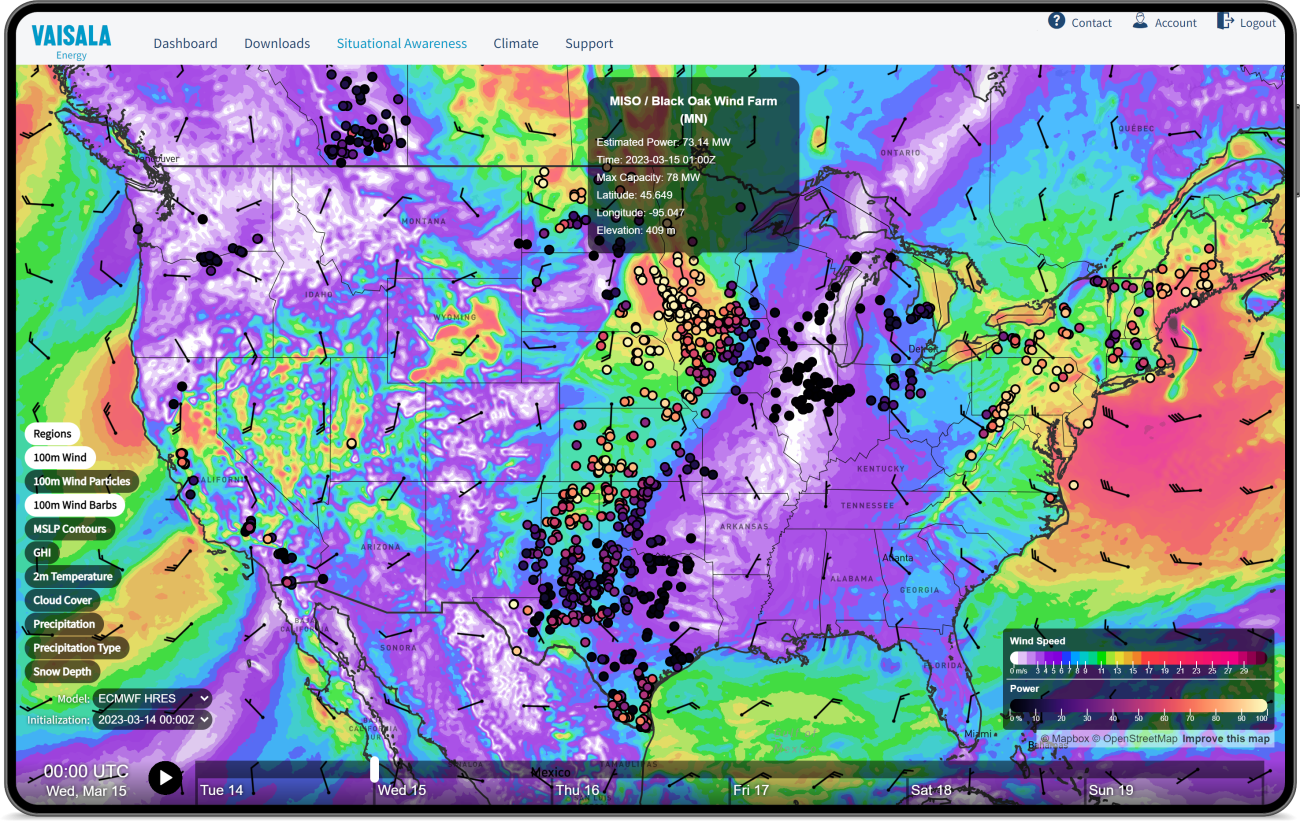
The Situational Awareness tool provides an animated six-day forecast of the key weather parameters for renewable energy globally and an intuitive, map-based visualization of renewable energy production across the major electricity trading markets in the United States and parts of Canada.

Forecasting renewable energy production
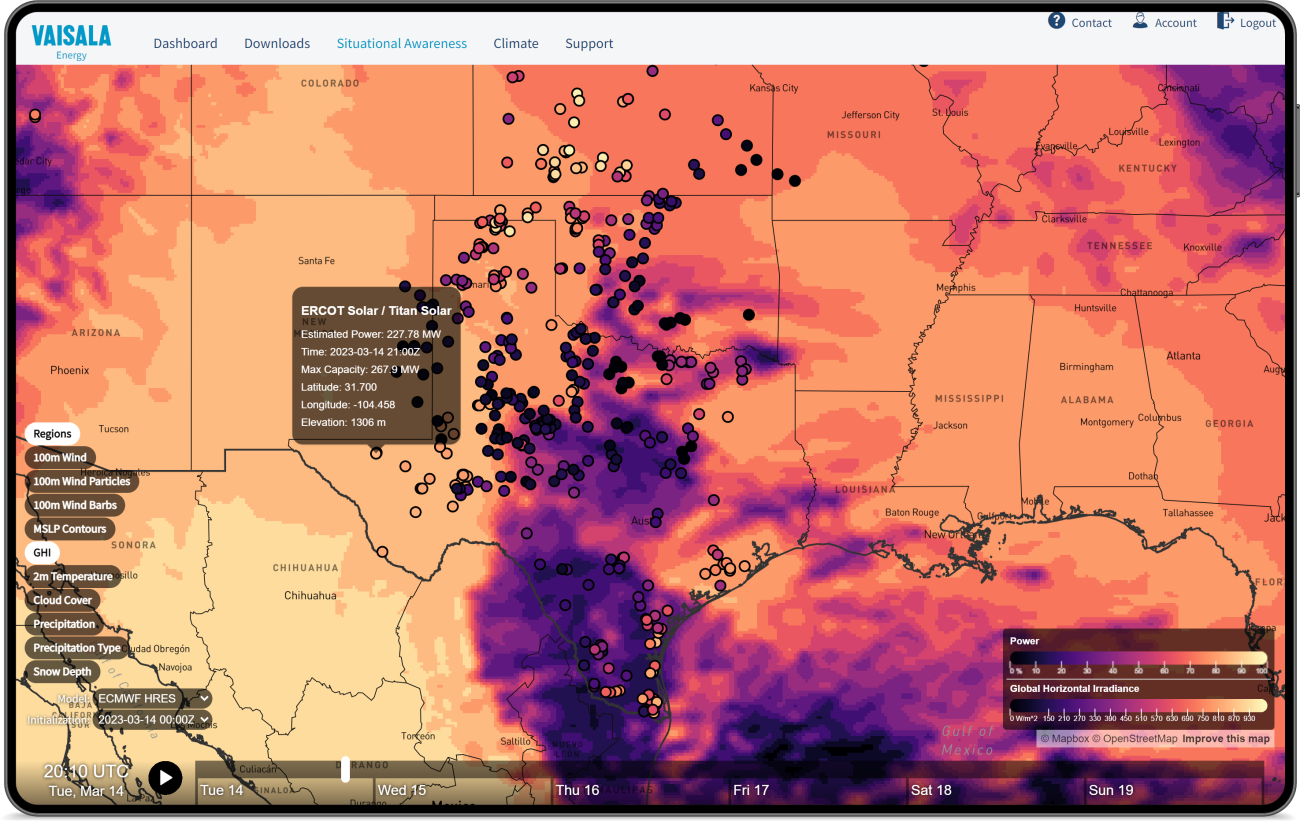
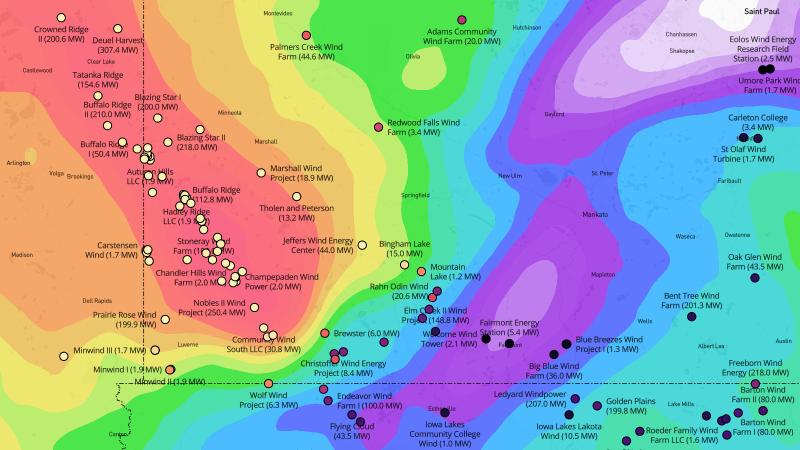
The new Situational Awareness tool forecasts how the weather will affect the power produced by renewable energy projects up to six days ahead. For wind projects, the tool provides map layers for visualizing wind speed at 100 meters above ground level (modern turbine hub height) and wind direction using either wind barbs or particles. For solar projects, the primary map layer of interest is global horizontal irradiance (GHI) at ground level. There are also layers for cloud cover, precipitation rate and type, snow depth, atmospheric pressure contours, and air temperature at 2 meters above ground level.
Individual energy projects are marked on the map with a helpful, at-a-glance color scale that shows the forecasted percentage of nameplate capacity at the current point on the timeline. You can look ahead with an animated six-day forecast or review previous forecasts from up to 60 hours in the past. Start and stop the animation at any point and step forward and back through the timeline with convenient controls. The forecasts use the ECMWF HRES data model.

Available now
For existing customers, the Situational Awareness tool is a complimentary part of your Vaisala Xweather energy subscription. Simply sign in to the Vaisala energy portal to see the projects and regions covered by your subscription.
For new customers, please contact us to learn more about renewable energy forecasting with Vaisala Xweather.


Add new comment