Lightning data to kick off Lightning Safety Awareness Week


A huge amount of lightning occurs around the world and in the United States – more than you might think. Every cloud-to-ground flash represents a threat to human safety. And every in-cloud pulse can indicate a possible lightning threat from cloud-to-ground flashes nearby.
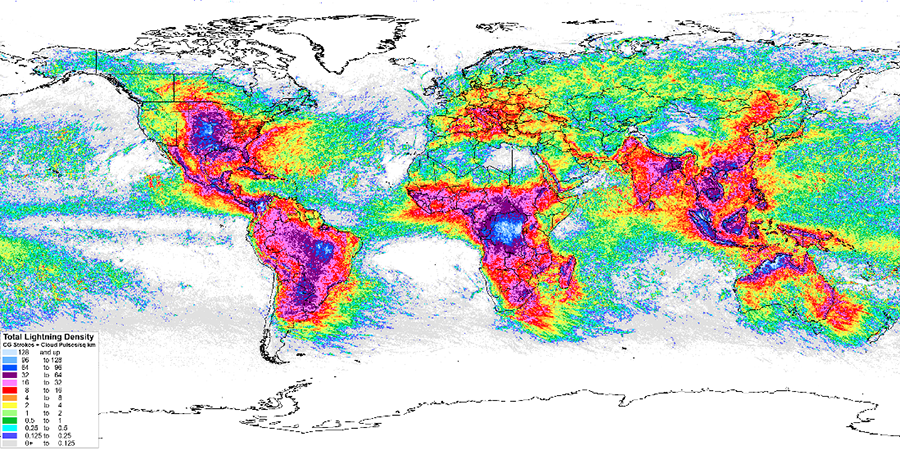
But how much? Around the world, 10,661,259,470 lightning events were detected in the last five years. That’s over two billion a year. How do we know this? From the Global Lightning Dataset GLD360 network owned and operated by Vaisala using ground-based sensors. Most lightning is over land, including central Africa, North and South America, and the large islands and landmasses of Southeast Asia. Lightning is not unusual over the oceans, especially near land, and some is detected over the distant reaches of the southern Atlantic and Pacific. The least lightning is over the Arctic and rarely over the Antarctic and eastern Sahara.
Over the U.S. in 2019, there were 216,978,014 lightning events recorded – that’s nearly a quarter of a billion. These counts are from National Lightning Detection Network (NLDN) owned and operated by Vaisala. NLDN has been operating continually for over 30 years and covers the lower 48 states in the U.S. with ground-based antennas. Of the nearly 217 million lightning events detected in 2019, most were in cloud.
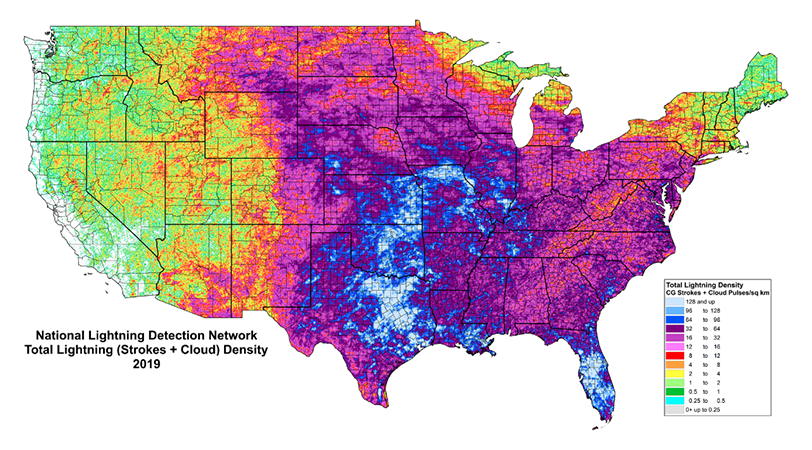
Texas had the most total lightning events in 2019, over 47 million. The next highest was Oklahoma at 15 million, closely followed by Kansas, then Missouri, and Florida.
But the real measure to take into account is the area of the states. Then, Florida comes out on top at 244 total lightning events per square mile per year in the last five years over the whole state. The next highest densities are in Oklahoma, Louisiana, Missouri, and Texas.
All of these GLD360 and NLDN maps and tables can be found here. This link also connects to the National Weather Service website on lightning safety that is the most complete such site in the world. The National Lightning Safety Council linked here also has daily information specifically for Lightning Safety Awareness Week on June 21 - 27.
Important update! NLDN has a new capability – to identify lightning with continuing current. The extreme heating caused by continuing current is more likely to start forest fires and cause damage to facilities such as power utilities and wind turbines. Lightning with continuing current is a small fraction of all cloud-to-ground lightning and is identified by combining satellite and ground-based lightning data. The satellite-borne Geostationary Lightning Mapper provides duration data that are matched in time with NLDN flashes in a patented approach that provides the first operational dataset for continuing current.
Be sure to follow Vaisala blogs for the rest of the week on uses of lightning data for human safety. Also, please visit the links to the National Weather Service and National Lightning Safety Council websites this week and in the future.
Add new comment