
Share information
Vaisala has two series of shares: series K shares and series A shares. Series A shares are traded on the Nasdaq Helsinki Ltd. Vaisala has 36,436,728 shares, of which 3,093,128 are series K shares and 33,343,600 are series A shares. Series A shares carry one vote at shareholders' meetings and Series K shares twenty votes each. Both series entitle their holders to an equal dividend. Vaisala’s share capital is EUR 7,660,808.
- Vaisala's shares listed in the OTC-list In 1988
- A series shares quoted in Nasdaq Helsinki stock exchange since 1994
- 1:2 share split on April 12, 2018
- 1:4 share split on March 23, 2000
Vaisala A shares
Nasdaq Helsinki
Segment: Large cap companies
Trading code: VAIAS
ISIN code: FI0009900682
Currency: EUR
Industry classification: Industrials
News agencies
Reuters: VAIAS.HE
Bloomberg: VAIAS.FH
Vaisala shares are registered in the Finnish Book-Entry Register maintained by the Euroclear Finland Ltd.
Nasdaq
Euroclear Finland
Financial Supervisory Authority
Securities Market Association
- Basic share information
- Treasury shares
- Key share figures
- Dividend
- Share register and changes of address
Treasury shares
Authorization for the directed repurchase of own A shares
The 2025 Annual General Meeting authorized the Board of Directors to resolve on the directed repurchase of a maximum of 800,000 of the company's own series A shares in one or more instalments by using company's unrestricted equity. The authorization is valid until the closing of the next Annual General Meeting, however, no longer than September 25, 2026.
Authorization on the issuance of the shares, transfer of treasury shares and issuance of special rights entitling to shares
The Annual General Meeting authorized the Board of Directors to resolve on the issuance of the shares, transfer of treasury shares and issuance of special rights entitling to shares. The authorization concerns only series A shares. The Board may issue either new shares or transfer treasury shares held by the company to a maximum of 3,000,000 shares. The authorization can also be used as part of the company’s incentive plans for up to 1,000,000 shares. The shares can be issued or transferred for consideration or without consideration. Shares or special rights entitling to shares can be issued in deviation from the shareholders’ pre-emptive rights by way of a directed issue if there is a weighty financial reason from company’s point of view, such as using the shares as a consideration in potential mergers or acquisitions, to finance investments, or as a part of the company’s incentive plans. The subscription price of the shares can instead of cash also be paid in full or in part as contribution in kind. The authorization is valid until September 25, 2026. The authorization for the company's incentive program shall however be valid until March 25, 2030.
Repurchasing of own shares in 2025
In April 2025, the Board of Directors decided to exercise the authorization of the 2025 Annual General Meeting to repurchase of company’s own shares and to start repurchases of maximum 65,000 own series A shares. Purchased shares will be used as a part of Vaisala’s incentive plans. The repurchases started on May 6, 2025, and ended on September 9, 2025. During this period, Vaisala repurchased a total of 65,000 own series A shares for an average price of EUR 46.2327 per share. The shares were repurchased in public trading on Nasdaq Helsinki Ltd. at the market price prevailing at the time of purchase.
Transfer of company's treasury shares
In July 2025, a total of 1,000 of Vaisala Corporation's series A treasury shares were conveyed without consideration to a person participating in the Restricted Share Unit Plan 2022–2026 under the terms and conditions of the plan. The directed share issue was based on an authorization given by the Annual General Meeting held on March 25, 2025.
In June 2025, a total of 750 of Vaisala Corporation's series A treasury shares were conveyed without consideration to a person participating in the Restricted Share Unit Plan 2022–2026 under the terms and conditions of the plan. The directed share issue was based on an authorization given by the Annual General Meeting held on March 25, 2025.
In April 2025, a total of 8,942 of Vaisala Corporation's series A treasury shares were conveyed without consideration to the six key employees participating in the Matching Share Plan 2022–2026 and Restricted Share Unit Plan 2022–2026 under the terms and conditions of the plans. The directed share issue was based on an authorization given by the Annual General Meeting held on March 25, 2025.
In March 2025, a total of 26,167 of Vaisala Corporation's treasury shares were conveyed without consideration to the 47 key employees participating in the Performance Share Plans 2022–2024, 2023–2025, and 2024–2026 under the terms and conditions of the plans. The directed share issue was based on an authorization given by the Annual General Meeting held on March 26, 2024.
Number of treasury shares
On December 31, 2025, the number of series A treasury shares was 180,290 (updated quarterly).
Key share figures
| EUR | 2025 | 2024 | 2023 | 2022 | 2021 |
|---|---|---|---|---|---|
| Earnings per share (EPS) | 1.65 | 1.76 | 1.35 | 1.24 | 1.08 |
| Diluted earnings per share (EPS) | 1.64 | 1.75 | 1.35 | 1.24 | 1.07 |
| Cash flow from operating activities per share | 2.49 | 2.17 | 2.31 | 0.82 | 2.21 |
| Equity per share | 8.99 | 8.50 | 7.39 | 6.91 | 6.36 |
| Dividend per share | 0.86** | 0.85 | 0.75 | 0.72 | 0.68 |
| Dividend per earnings, % | 52.2** | 48.4 | 55.6 | 57.9 | 62.9 |
| Effective dividend yield, % | 1.95** | 1.76 | 1.89 | 1.83 | 1.28 |
| Price/earnings (P/E) | 26.74 | 27.57 | 29.51 | 31.71 | 49.31 |
| A-share price development |
| ||||
| highest price | 54.90 | 50.00 | 44.55 | 54.40 | 55.80 |
| lowest price | 39.70 | 32.60 | 30.30 | 36.15 | 30.00 |
| volume weighted average price | 47.18 | 41.95 | 38.28 | 43.03 | 39.45 |
| closing price | 44.05 | 48.40 | 39.70 | 39.45 | 53.30 |
| Market capitalization at end of financial year*, EUR million | 1,597.1 | 1,756.0 | 1,439.2 | 1,429.2 | 1,924.3 |
| A shares traded |
| ||||
| pieces | 5,960,283 | 2,808,545 | 3,089,946 | 2,384,806 | 2,939,088 |
| % of total series | 17.9 | 8.6 | 10.4 | 8.0 | 9.9 |
| Number of shares, pieces | 36,436,728 | 36,436,728 | 36,436,728 | 36,436,728 | 36,436,728 |
| A shares | 33,343,600 | 32,809,875 | 29,705,636 | 29,705,636 | 29,705,636 |
| K shares | 3,093,128 | 3,626,853 | 6,731,092 | 6,731,092 | 6,731,092 |
| Outstanding shares at Dec. 31* | 36,256,438 | 36,284,579 | 36,251,252 | 26,228,241 | 36,101,073 |
* Including series A and K shares, excluding treasury shares. Series K shares are valued using the closing price for the series A share on the last trading day of December.
** According to the Board's dividend proposal
Trading information is based on Nasdaq Helsinki Ltd. statistics.
Dividend
Share register and changes of address
Vaisala’s shares are registered in the Finnish Book-Entry Register maintained by the Euroclear Finland Ltd.
Shareholders must notify changes of address to their book-entry securities account operator. Vaisala does not keep a record of the addresses of its shareholders.
If the account is maintained at the Euroclear Finland Ltd’s (earlier Finnish Central Securities Depository) account operator, please send the notification to:
Euroclear Finland Ltd.
P.O. Box 1110, FI-00101 Helsinki
Customer Account Services, open Monday to Friday 9 a.m.–4 p.m. EET
Urho Kekkosen katu 5C, 8th floor
Phone: +358 800 180 500
Fax: +358 20 770 6656
Email: [email protected]
Basic share information
Treasury shares
Authorization for the directed repurchase of own A shares
The 2025 Annual General Meeting authorized the Board of Directors to resolve on the directed repurchase of a maximum of 800,000 of the company's own series A shares in one or more instalments by using company's unrestricted equity. The authorization is valid until the closing of the next Annual General Meeting, however, no longer than September 25, 2026.
Authorization on the issuance of the shares, transfer of treasury shares and issuance of special rights entitling to shares
The Annual General Meeting authorized the Board of Directors to resolve on the issuance of the shares, transfer of treasury shares and issuance of special rights entitling to shares. The authorization concerns only series A shares. The Board may issue either new shares or transfer treasury shares held by the company to a maximum of 3,000,000 shares. The authorization can also be used as part of the company’s incentive plans for up to 1,000,000 shares. The shares can be issued or transferred for consideration or without consideration. Shares or special rights entitling to shares can be issued in deviation from the shareholders’ pre-emptive rights by way of a directed issue if there is a weighty financial reason from company’s point of view, such as using the shares as a consideration in potential mergers or acquisitions, to finance investments, or as a part of the company’s incentive plans. The subscription price of the shares can instead of cash also be paid in full or in part as contribution in kind. The authorization is valid until September 25, 2026. The authorization for the company's incentive program shall however be valid until March 25, 2030.
Repurchasing of own shares in 2025
In April 2025, the Board of Directors decided to exercise the authorization of the 2025 Annual General Meeting to repurchase of company’s own shares and to start repurchases of maximum 65,000 own series A shares. Purchased shares will be used as a part of Vaisala’s incentive plans. The repurchases started on May 6, 2025, and ended on September 9, 2025. During this period, Vaisala repurchased a total of 65,000 own series A shares for an average price of EUR 46.2327 per share. The shares were repurchased in public trading on Nasdaq Helsinki Ltd. at the market price prevailing at the time of purchase.
Transfer of company's treasury shares
In July 2025, a total of 1,000 of Vaisala Corporation's series A treasury shares were conveyed without consideration to a person participating in the Restricted Share Unit Plan 2022–2026 under the terms and conditions of the plan. The directed share issue was based on an authorization given by the Annual General Meeting held on March 25, 2025.
In June 2025, a total of 750 of Vaisala Corporation's series A treasury shares were conveyed without consideration to a person participating in the Restricted Share Unit Plan 2022–2026 under the terms and conditions of the plan. The directed share issue was based on an authorization given by the Annual General Meeting held on March 25, 2025.
In April 2025, a total of 8,942 of Vaisala Corporation's series A treasury shares were conveyed without consideration to the six key employees participating in the Matching Share Plan 2022–2026 and Restricted Share Unit Plan 2022–2026 under the terms and conditions of the plans. The directed share issue was based on an authorization given by the Annual General Meeting held on March 25, 2025.
In March 2025, a total of 26,167 of Vaisala Corporation's treasury shares were conveyed without consideration to the 47 key employees participating in the Performance Share Plans 2022–2024, 2023–2025, and 2024–2026 under the terms and conditions of the plans. The directed share issue was based on an authorization given by the Annual General Meeting held on March 26, 2024.
Number of treasury shares
On December 31, 2025, the number of series A treasury shares was 180,290 (updated quarterly).
Key share figures
| EUR | 2025 | 2024 | 2023 | 2022 | 2021 |
|---|---|---|---|---|---|
| Earnings per share (EPS) | 1.65 | 1.76 | 1.35 | 1.24 | 1.08 |
| Diluted earnings per share (EPS) | 1.64 | 1.75 | 1.35 | 1.24 | 1.07 |
| Cash flow from operating activities per share | 2.49 | 2.17 | 2.31 | 0.82 | 2.21 |
| Equity per share | 8.99 | 8.50 | 7.39 | 6.91 | 6.36 |
| Dividend per share | 0.86** | 0.85 | 0.75 | 0.72 | 0.68 |
| Dividend per earnings, % | 52.2** | 48.4 | 55.6 | 57.9 | 62.9 |
| Effective dividend yield, % | 1.95** | 1.76 | 1.89 | 1.83 | 1.28 |
| Price/earnings (P/E) | 26.74 | 27.57 | 29.51 | 31.71 | 49.31 |
| A-share price development |
| ||||
| highest price | 54.90 | 50.00 | 44.55 | 54.40 | 55.80 |
| lowest price | 39.70 | 32.60 | 30.30 | 36.15 | 30.00 |
| volume weighted average price | 47.18 | 41.95 | 38.28 | 43.03 | 39.45 |
| closing price | 44.05 | 48.40 | 39.70 | 39.45 | 53.30 |
| Market capitalization at end of financial year*, EUR million | 1,597.1 | 1,756.0 | 1,439.2 | 1,429.2 | 1,924.3 |
| A shares traded |
| ||||
| pieces | 5,960,283 | 2,808,545 | 3,089,946 | 2,384,806 | 2,939,088 |
| % of total series | 17.9 | 8.6 | 10.4 | 8.0 | 9.9 |
| Number of shares, pieces | 36,436,728 | 36,436,728 | 36,436,728 | 36,436,728 | 36,436,728 |
| A shares | 33,343,600 | 32,809,875 | 29,705,636 | 29,705,636 | 29,705,636 |
| K shares | 3,093,128 | 3,626,853 | 6,731,092 | 6,731,092 | 6,731,092 |
| Outstanding shares at Dec. 31* | 36,256,438 | 36,284,579 | 36,251,252 | 26,228,241 | 36,101,073 |
* Including series A and K shares, excluding treasury shares. Series K shares are valued using the closing price for the series A share on the last trading day of December.
** According to the Board's dividend proposal
Trading information is based on Nasdaq Helsinki Ltd. statistics.
Dividend
Share register and changes of address
Vaisala’s shares are registered in the Finnish Book-Entry Register maintained by the Euroclear Finland Ltd.
Shareholders must notify changes of address to their book-entry securities account operator. Vaisala does not keep a record of the addresses of its shareholders.
If the account is maintained at the Euroclear Finland Ltd’s (earlier Finnish Central Securities Depository) account operator, please send the notification to:
Euroclear Finland Ltd.
P.O. Box 1110, FI-00101 Helsinki
Customer Account Services, open Monday to Friday 9 a.m.–4 p.m. EET
Urho Kekkosen katu 5C, 8th floor
Phone: +358 800 180 500
Fax: +358 20 770 6656
Email: [email protected]

Share tools

Shareholders
Major shareholders and ownership structure
The list of Vaisala's major shareholders is based on the information given by Euroclear Finland on the holdings of Vaisala's biggest shareholders, as well as on the shareholders' own notifications.
Managers' transactions
Vaisala Corporation managers and their closely associated persons referred to in the Market Abuse Regulation ((EU) No 596/2014, "MAR") are requested to follow the below instructions for notifying transactions as of July 3, 2016.
Such notifications shall be made to Vaisala Corporation and the FIN-FSA immediately after the date of the transaction
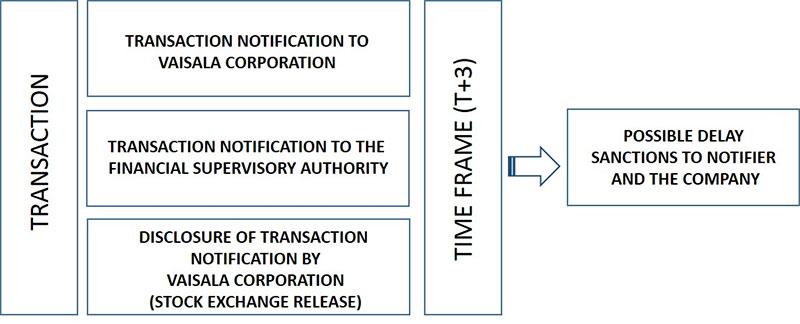
Instructions on notifying of transactions
1. Inform Vaisala
Immediately after conducting a transaction, inform Vaisala by email to [email protected].
2. Fill in the form
Fill in the form regarding the transaction on FIN-FSA website. More information can be found at FIN-FSA website.
Details for the form:
| LEI code of Vaisala Corporation | LEI: 743700RNDD7KU11HW873 |
| Short name of Vaisala Corporation share | VAIAS (A share) |
| ISIN code of Vaisala Corporation share | FI0009900682 (A share) |
| Notification reference | Generated automatically (no need to fill in) |
3. Deliver the notification
Send the filled form attached to an email to Vaisala promptly after the date of the transaction. Do not send the form by post due to short notification timetable.
- Send to Vaisala: [email protected]
- Please also add your phone number to the e-mail message so that we can contact you if Vaisala has questions about the notification
Vaisala will publish the notification as a stock exchange release without delay and no later than two business days after receipt of the notification.
Flaggings
Shareholders of listed companies have an obligation to notify both the Financial Supervisory Authority (FSA) and the listed company of changes in their holdings. Listed companies have an obligation to publicly disclose the shareholder’s notification.
Under the provisions of the Finnish Securities Markets Act, changes must be disclosed when the holding reaches, exceeds or falls below 5%, 10%, 15%, 20%, 25%, 30%, 50%, two thirds or 90% of the voting rights or share capital of the company.
Please send the flagging notifications without undue delay to Vaisala using the email address [email protected].
2025
February 28, 2025
Mandatum Oyj announced that its votes in Vaisala Corporation, including holding through financial instruments, fell below the threshold of five (5) percent on February 26, 2025. Stock exchange release
2024
September 6, 2024
The Finnish Academy of Science and Letters announced that its total number of Vaisala Corporation shares decreased to below five (5) per cent of the share capital of Vaisala Corporation on September 6, 2024. Stock exchange release
May 10, 2024
Novametor Oy announced that its votes in Vaisala Corporation exceeded the threshold of twenty (20) percent of shares on May 10, 2024. The share of the total shares remained unchanged. Stock exchange release
May 10, 2024
Raimo Voipio announced that his votes in Vaisala Corporation, including holding through financial instruments, fell below the threshold of five (5) percent of shares on May 10, 2024. The share of the total shares remained unchanged. Stock exchange release
May 10, 2024
Mikko Voipio announced that his votes in Vaisala Corporation, including holding through financial instruments, fell below the threshold of five (5) percent of shares on May 10, 2024. The share of the total shares remained unchanged. Stock exchange release
May 10, 2024
Anja Caspers announced that her votes in Vaisala Corporation, including holding through financial instruments, fell below the threshold of five (5) percent of shares on May 10, 2024. The share of the total shares remained unchanged. Stock exchange release
May 10, 2024
Mandatum Oyj announced that its votes in Vaisala Corporation, including holding through financial instruments, exceeded the threshold of five (5) percent of shares on May 10, 2024. Stock exchange release
2017
September 13, 2017
Nordea Funds Ltd announced that its total number of shares in Vaisala Corporation increased above the 5 percent threshold on September 13, 2017. Stock exchange release
Shareholder agreements
The company’s Board of Directors is not aware of any agreements concerning the ownership of the company’s shares and the use of their voting rights.
Major shareholders and ownership structure
The list of Vaisala's major shareholders is based on the information given by Euroclear Finland on the holdings of Vaisala's biggest shareholders, as well as on the shareholders' own notifications.
Managers' transactions
Vaisala Corporation managers and their closely associated persons referred to in the Market Abuse Regulation ((EU) No 596/2014, "MAR") are requested to follow the below instructions for notifying transactions as of July 3, 2016.
Such notifications shall be made to Vaisala Corporation and the FIN-FSA immediately after the date of the transaction
Instructions on notifying of transactions
1. Inform Vaisala
Immediately after conducting a transaction, inform Vaisala by email to [email protected].
2. Fill in the form
Fill in the form regarding the transaction on FIN-FSA website. More information can be found at FIN-FSA website.
Details for the form:
| LEI code of Vaisala Corporation | LEI: 743700RNDD7KU11HW873 |
| Short name of Vaisala Corporation share | VAIAS (A share) |
| ISIN code of Vaisala Corporation share | FI0009900682 (A share) |
| Notification reference | Generated automatically (no need to fill in) |
3. Deliver the notification
Send the filled form attached to an email to Vaisala promptly after the date of the transaction. Do not send the form by post due to short notification timetable.
- Send to Vaisala: [email protected]
- Please also add your phone number to the e-mail message so that we can contact you if Vaisala has questions about the notification
Vaisala will publish the notification as a stock exchange release without delay and no later than two business days after receipt of the notification.
Flaggings
Shareholders of listed companies have an obligation to notify both the Financial Supervisory Authority (FSA) and the listed company of changes in their holdings. Listed companies have an obligation to publicly disclose the shareholder’s notification.
Under the provisions of the Finnish Securities Markets Act, changes must be disclosed when the holding reaches, exceeds or falls below 5%, 10%, 15%, 20%, 25%, 30%, 50%, two thirds or 90% of the voting rights or share capital of the company.
Please send the flagging notifications without undue delay to Vaisala using the email address [email protected].
2025
February 28, 2025
Mandatum Oyj announced that its votes in Vaisala Corporation, including holding through financial instruments, fell below the threshold of five (5) percent on February 26, 2025. Stock exchange release
2024
September 6, 2024
The Finnish Academy of Science and Letters announced that its total number of Vaisala Corporation shares decreased to below five (5) per cent of the share capital of Vaisala Corporation on September 6, 2024. Stock exchange release
May 10, 2024
Novametor Oy announced that its votes in Vaisala Corporation exceeded the threshold of twenty (20) percent of shares on May 10, 2024. The share of the total shares remained unchanged. Stock exchange release
May 10, 2024
Raimo Voipio announced that his votes in Vaisala Corporation, including holding through financial instruments, fell below the threshold of five (5) percent of shares on May 10, 2024. The share of the total shares remained unchanged. Stock exchange release
May 10, 2024
Mikko Voipio announced that his votes in Vaisala Corporation, including holding through financial instruments, fell below the threshold of five (5) percent of shares on May 10, 2024. The share of the total shares remained unchanged. Stock exchange release
May 10, 2024
Anja Caspers announced that her votes in Vaisala Corporation, including holding through financial instruments, fell below the threshold of five (5) percent of shares on May 10, 2024. The share of the total shares remained unchanged. Stock exchange release
May 10, 2024
Mandatum Oyj announced that its votes in Vaisala Corporation, including holding through financial instruments, exceeded the threshold of five (5) percent of shares on May 10, 2024. Stock exchange release
2017
September 13, 2017
Nordea Funds Ltd announced that its total number of shares in Vaisala Corporation increased above the 5 percent threshold on September 13, 2017. Stock exchange release
Shareholder agreements
The company’s Board of Directors is not aware of any agreements concerning the ownership of the company’s shares and the use of their voting rights.