Understand the risk: See the lightning density for any location on Earth
Lightning impacts outdoor operations, threatens safety, and starts wildfires. If your business is vulnerable to lightning, do you know how much lightning your region sees on average every year? Find out with the Vaisala Interactive Lightning Map, which now includes complete data for 2022 and a new 3D globe view.
An interactive tool to explore lightning density globally
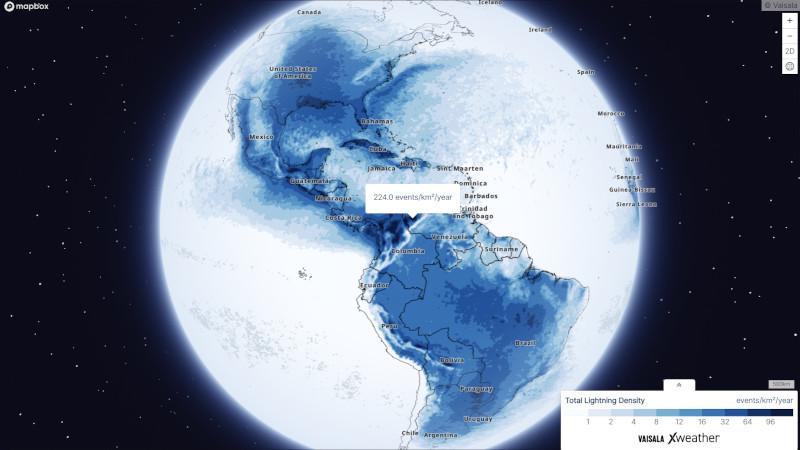
The map shows average lightning density values around the world using data reported by Vaisala’s lightning detection networks: GLD360 global lightning detection network and U.S. National Lightning Detection Network NLDN. They provide excellent coverage across all oceans and continents, and between 2016 and 2022, detected over 14 billion lightning events, which include both cloud-to-ground strokes and in-cloud pulses.
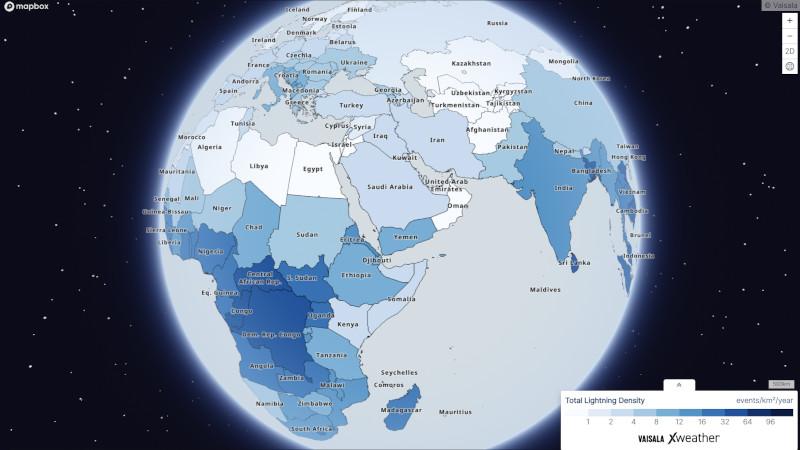
You can interact with the map by hovering over a specific area to see the average number of lightning events per km² per year. Zoom in to see your area of interest down to the state or county level. Expand the legend and select the density contour layer to see a simplified version of gridded lightning density data.
New 3D globe view
The updated map now uses the Mapbox Globe view as the default view, improving the projections of each country. This globe view wraps the lightning density data around a sphere and gives a three-dimensional feel to the map. To see the density data for the entire world at once, simply click the “2D” icon in the top right to see a Web Mercator projection of the map.

Spinning the globe and zooming in and out is a natural, tactile way to explore the data.
Average lightning density updated with 2022 data
With today’s update, the map now shows yearly lightning density data, averaged from 2016 to 2022.

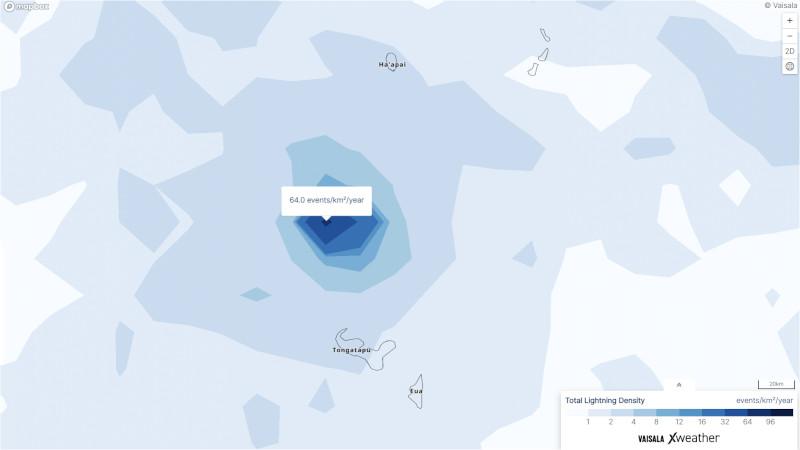
The average lightning density over the Hunga Volcano increased due to the high number of lightning events detected during the record-breaking eruption on January 15, 2022.
The cataclysmic eruption of the Hunga Volcano in the Kingdom of Tonga on January 15, 2022, produced the most extreme concentration of lightning ever detected. The GLD360 network recorded almost 400,000 lightning events near the Hunga Volcano that day. At one point, more than 25,500 lightning events were detected in just five minutes. More information about this incredible event can be found in the Vaisala Xweather 2022 Annual Lightning Report.
Enhancing safety for people and protecting assets
Understanding how much lightning occurs in an area helps safety professionals prepare appropriate lightning safety procedures to protect people involved in outdoor activities. Lightning density data helps lightning protection experts specify the right protection systems to safeguard important assets like buildings, data centers, and transmission lines. It also helps insurance underwriters and energy project analysts manage risk in the context of lightning damage.
The Interactive Lightning Map serves as a good indication of the general risk for an area. Contact Xweather sales for high-resolution historical lightning density data or visit the Xweather website to learn more about our real-time lightning data and software solutions.
Try out the Interactive Lightning Map to see how much lightning occurs in your corner of the world.


Add new comment