Where’s all my lightning?


Among the sights and sounds of summer are lightning and thunder. They are wedded with our culture, so much so, that in places with higher lightning frequency, fireflies are more typically called lightning bugs. As we are now past the peak of lightning season in the United States, we went back and looked at how much lightning National Lightning Detection Network NLDN had detected from January through July, and the numbers surprised us.
Last year, we detected around 223 million total (in-cloud (IC) pulse and cloud-to-ground (CG) stroke) lightning events across the Continental United States, with more than 147 million of them happening by the end of July. Imagine our surprise when we saw the numbers that suggested a nearly 17% decrease in lightning in 2020! We set out to see what could cause the low numbers, including looking at the cumulative lightning counts for each month (Figure 1).
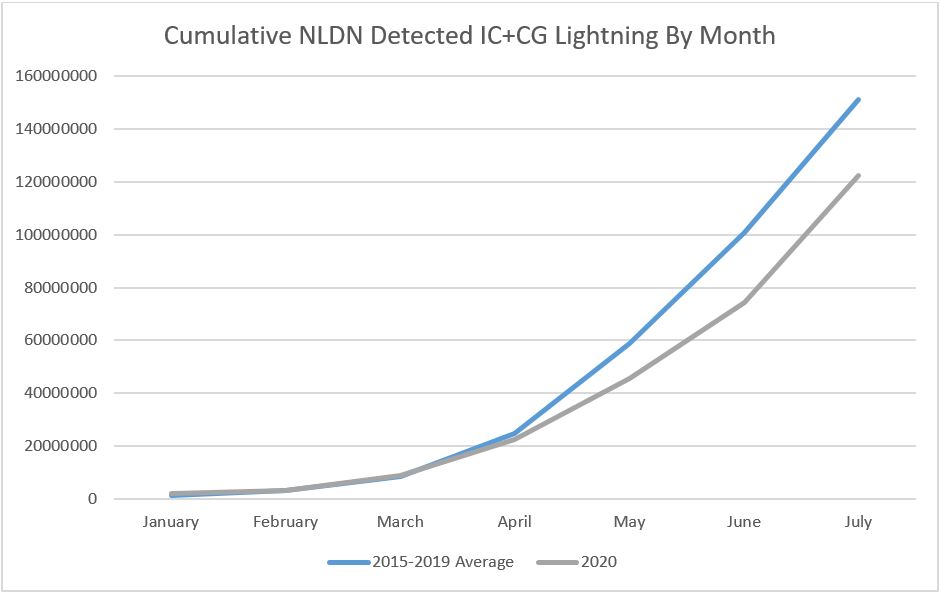
As can be seen in the line chart, lightning counts were near average from January through April and then dropped off significantly in May, June, and July, so we took a closer look at the May through July period (Figure 2).
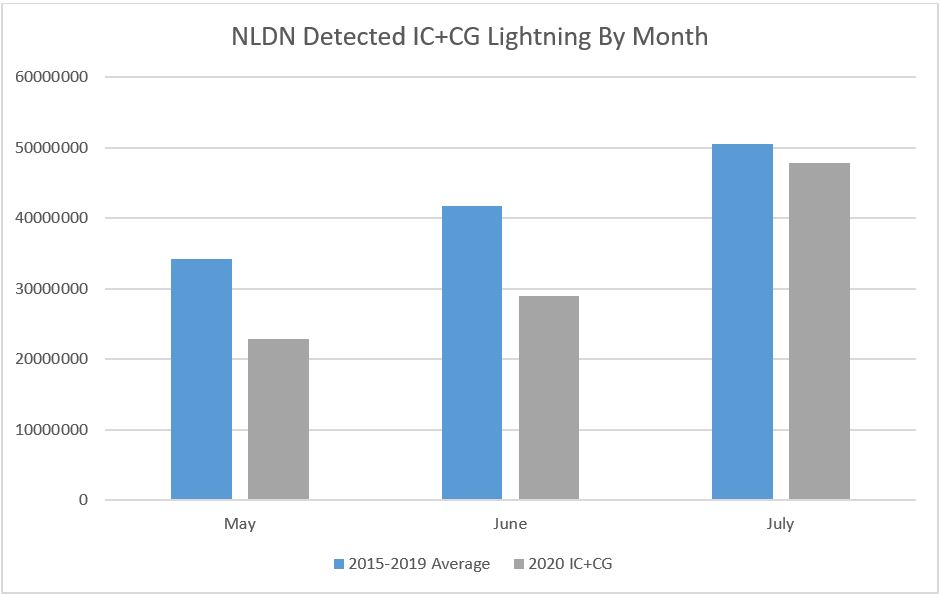
There was a significant decrease in the lightning counts for May and June 2020 when compared to the 5-year average. This year, NLDN detected only 51,963,294 in-cloud and cloud-to-ground lightning events, an astonishing 32% decrease from the average 76-million lightning events for those months! Although there was some noteworthy lightning activity during those months, including the Washington Monument being struck by lightning, these months were relatively tame from a thunderstorm perspective. As an example of the decrease in lightning, June 2019 had only three days when the NLDN detected fewer than 1-million lightning events. June 2020 had 15 such days!
It wasn’t enough for myself and my meteorologist colleagues to see that lightning was significantly down compared to average. We wanted to understand why, so we started where most meteorologists do, looking at the middle of the atmosphere (Figure 3).
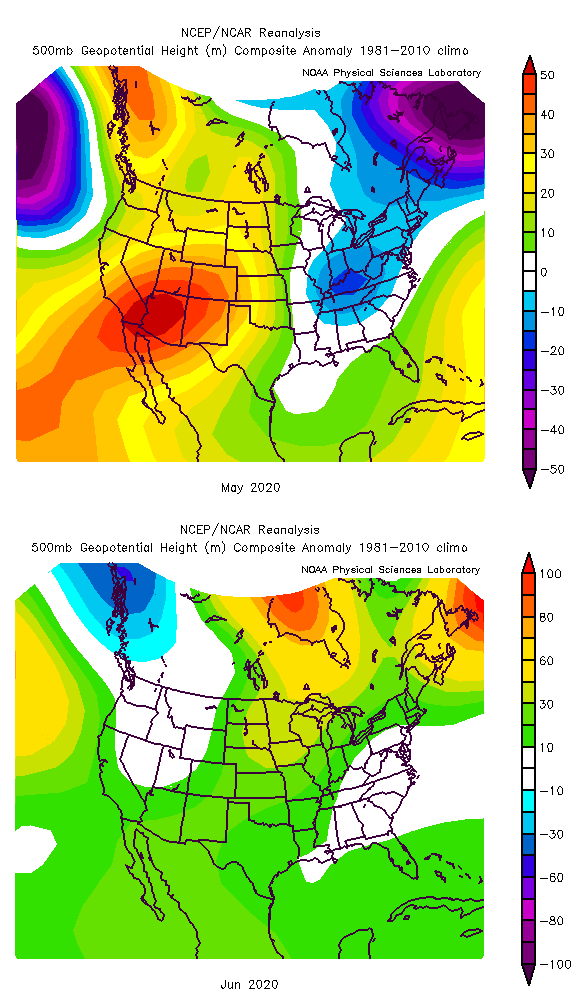
Meteorologists typically look at the 500mb map to identify the overall trough and ridge pattern of the upper atmosphere. Areas with ridging have calmer weather and areas with troughing have more stormy weather. Figure 3 shows how the height of the 500mb level for the months of May and June compared to the average of all Mays and Junes from 1981-2010. Lots of greens, yellows, oranges, and reds are visible on the maps, which represent areas of higher heights in the middle of the atmosphere – the telltale sign of a ridge. This can help suppress thunderstorm activity by preventing air from rising. Ridges also bring warmer air into the mid-levels of the atmosphere, reducing instability, another key ingredient for thunderstorm activity (Figure 4).
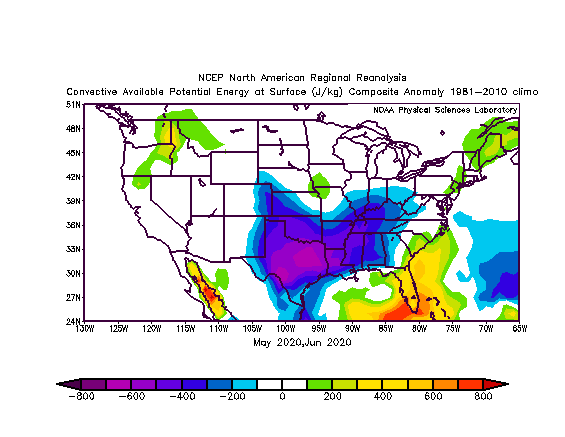
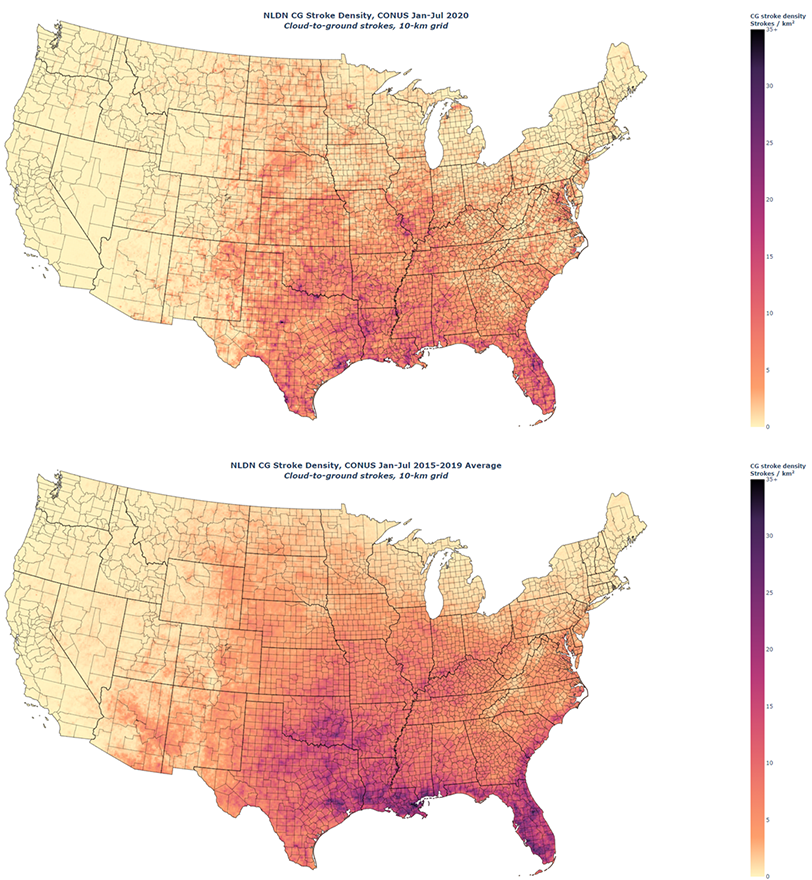
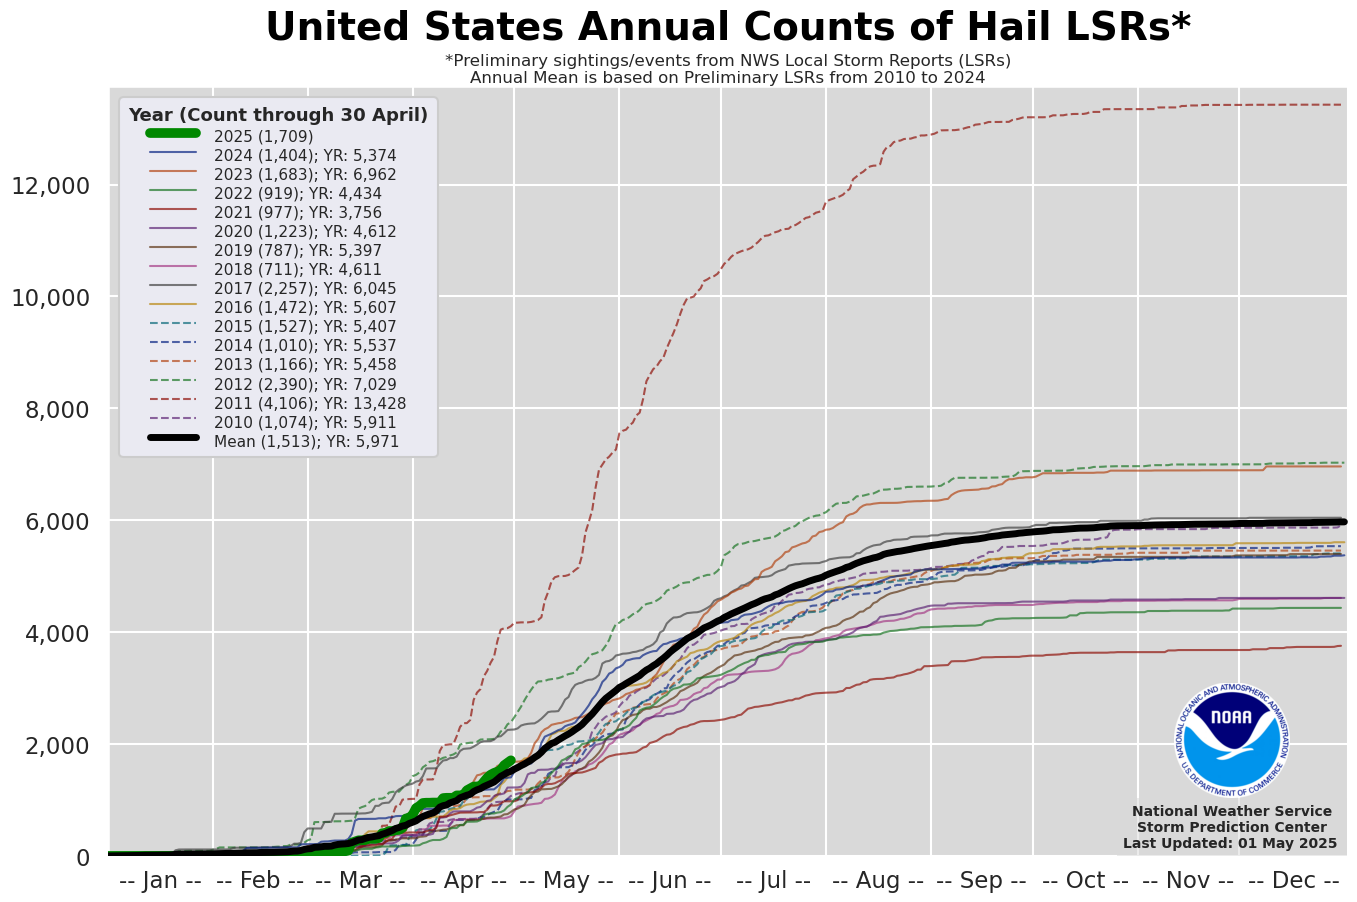
The blue, purple, and pink regions in Figure 4 show areas that have less Convective Available Potential Energy (CAPE) during May and June 2020 when compared to the 1981-2010 average. CAPE is a measure of atmospheric instability that is calculated from measurements by radiosondes during weather balloon launches. This large swath covers states that typically have the most lightning in the country, including Texas, Oklahoma, Kansas, Louisiana, and Mississippi (Figure 5). A lack of thunderstorms does have some positive effect, though. Severe hail reports to the Storm Prediction Center are at near record-lows.
Because of Vaisala’s extensive history of detecting and archiving lightning data in the United States, we are able to accurately identify changes in the amount of lightning from year to year. Armed with this high quality data, our team of lightning experts and meteorologists is then able to find the causes of these changes and help explain why our atmosphere behaves the way it does. Vaisala will continue to keep an eye on the lightning counts and release our Annual Lightning Report in early January 2021.
Add new comment