EURO 2020 – Strikes on the pitch
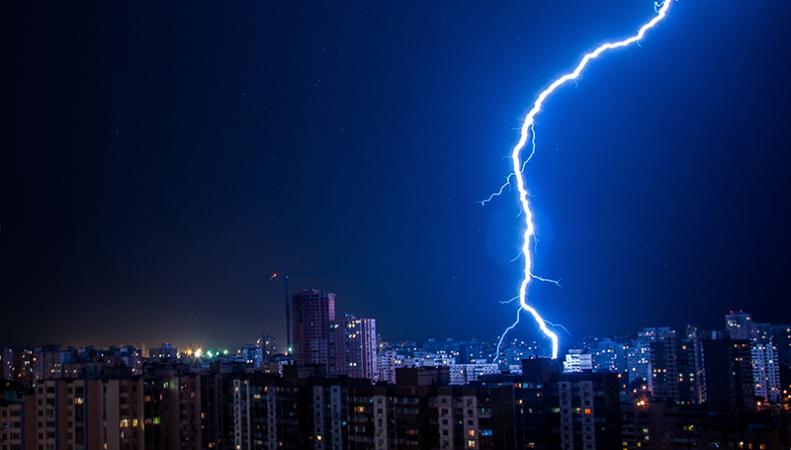

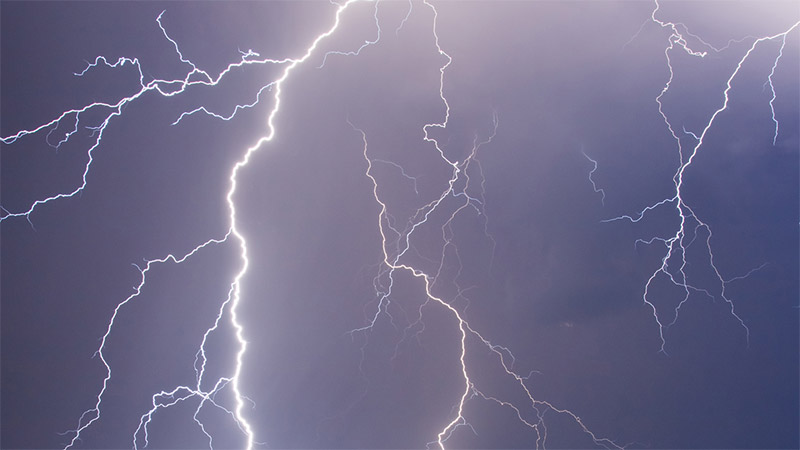
EURO 2020 is finally set to kick off with 24 of Europe’s best teams set to compete for the title. With Vaisala offices in England, France, Germany, and Finland, the interoffice rivalries are heating up and bragging rights are on the line! Thousands of spectators will be filling stadiums in eleven cities across Europe and Western Asia to cheer on their favorite football team (that’s soccer, for us fans in the United States). Because the matches will be taking place outdoors, we wanted to look at another one of our favorite topics – lightning – and how it relates to the tournament.
Previous Vaisala research has found that June and July are the peak lightning months across much of Europe, with much of the lightning occurring in the afternoon and evening hours. This is, of course, when the matches will be played. We have also analyzed lightning around baseball stadiums and recognize that a safety risk to players, fans, and officials can arise from nearby thunderstorms. Let’s look at lightning around the stadiums hosting the EURO 2020 tournament to get an idea of how much lightning may play a role in this year’s matches.
Lightning by the numbers
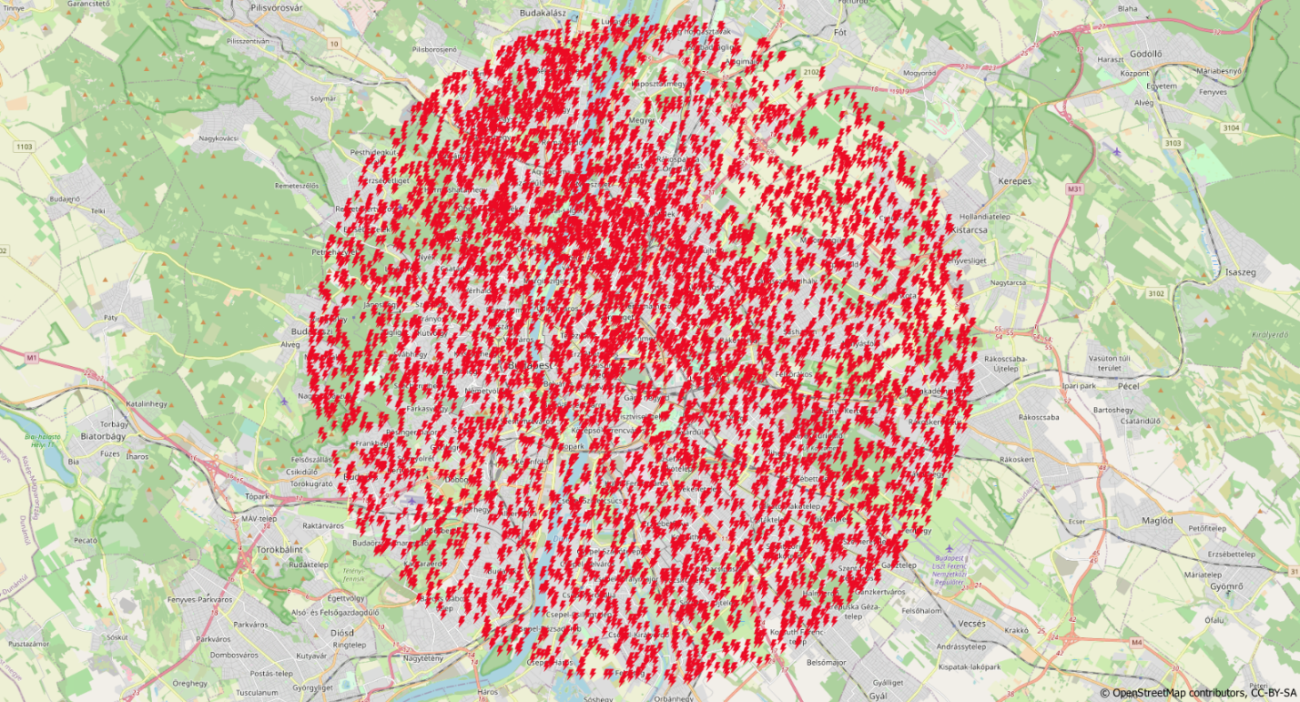
We looked at lightning data from our Global Lightning Dataset GLD360 within 12.8 kilometers (8 miles) of the EURO 2020 host stadiums during the tournament period of June 11 – July 11 in 2016 – 2020. In that five-year period, 20,631 lightning events were detected near the stadiums, although some stadiums had much more lightning than others. A total of 217 thunderstorm days, days in which lightning was detected within 12.8 km of a stadium, were counted – that’s 13% of the possible days.
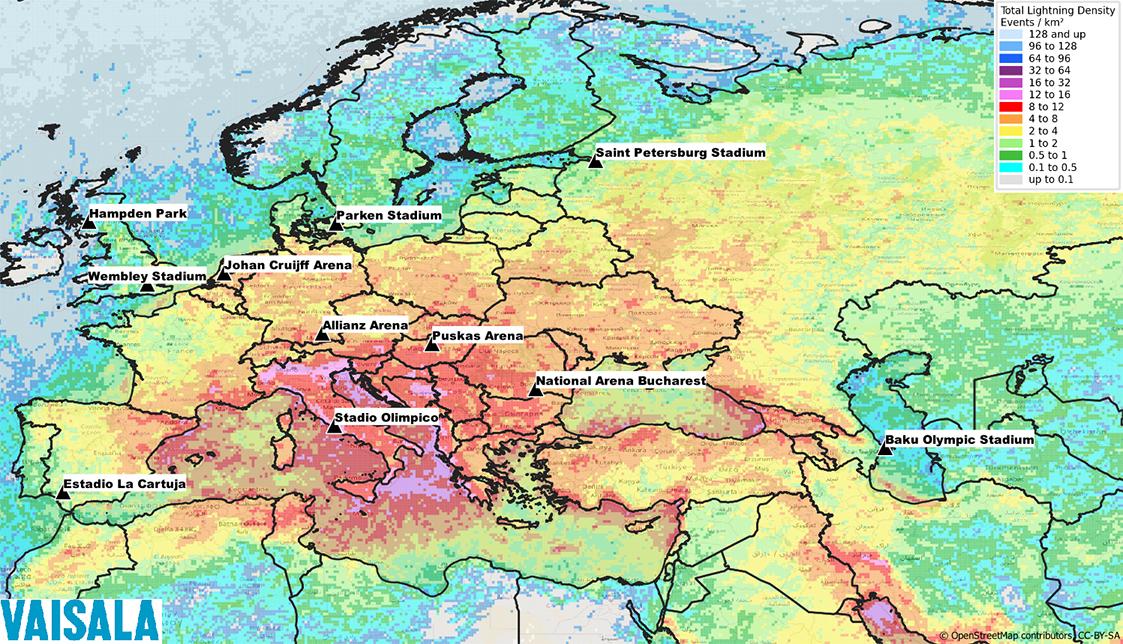
Figure 1 shows the distribution of lightning across Europe and Western Asia. Regions of higher and lower lightning activity are visible, and stadiums can be found in high and low lightning regions. It surprised us to see that the amount of lightning at each stadium during the tournament period didn’t necessarily line up with the annual rankings of lightning density. The table below shows the rankings for each stadium.
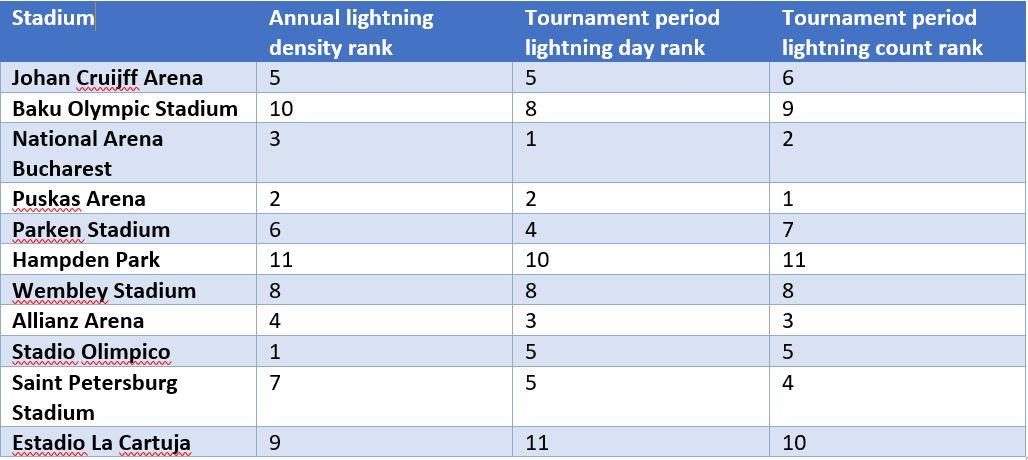
Lightning is a bit of a random natural phenomenon, so it won’t always happen that the number of lightning days is related to the lightning density or the amount of lightning. But in the table, it is pretty easy to identify the most lightning prone stadiums and the least lightning prone stadiums.
No matter which team wins the European championship, we’re all winners when we take lightning safety seriously. Let’s enjoy the matches over the next month and remember to get indoors when thunder roars! If you want to check out more lightning data for your favorite state or country around the world, be sure to check out our interactive lightning map!
Add new comment