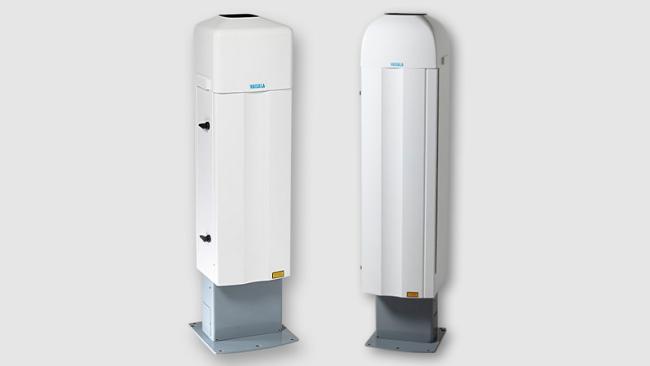
Ceilometer CL31 & CL51

Accurate cloud measurement, improved operations
Reliable cloud and visibility detection is crucial for modern forecasting, situational awareness, and air quality reporting. Compact, lightweight, and built on trusted Vaisala technology, CL31 and CL51 ceilometers are the ideal choices for assessing the boundary layer, cloud ceiling and base height, and more.
These globally recognized and trusted sensors provide crucial benefits for a wide range of applications:
- Excellent performance in all weather conditions, with consistent measurement accuracy down to nearly ground level
- Fully automated, 24/7 operation, with optical filters for solar defense and a tiltable automatic window blower with heater
- Exceptional detection that avoids pitfalls of dual-lens optics and provides reliable results at all heights
- Simple installation and maintenance, with low operational costs, extensive self-diagnostics, automated field adjustments, and design modularity
- Convenient visualizations and actionable insights, including an automatic algorithm for online retrieval

Which model is right for you?
The CL31 model detects three cloud layers simultaneously to a range of 7.6 km (25,000 ft) and generates a full scope of measurements, including precise assessment of inversion layers and nocturnal stable layers below 200 meters (650 ft).
The CL51 model is designed for high-range, cirrus cloud height profiling that also includes detailed data on low and middle layer clouds as well as vertical visibility. It has a detection range up to 15 km (49,200 ft).
Industry Applications
Aviation Applications
Meteorology Applications

Urban & Industrial Systems Applications
Product documentation
More downloads

Get Started with Ceilometer CL31 & CL51
By making the CL31 or CL51 the foundation of your atmospheric awareness, you can dramatically improve your operations and decision-making. Contact us now to see which technology is right for you.