Expert article
Temperature mapping FAQ: your top questions answered by a Vaisala GMP expert
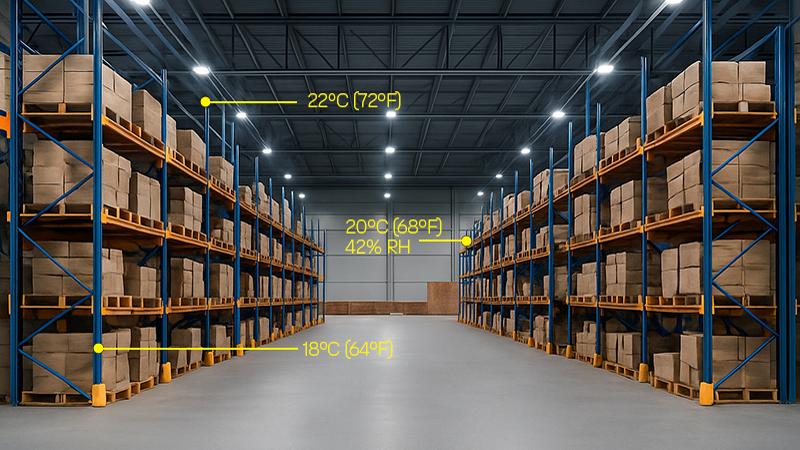



Temperature mapping is a study that measures temperature, and often humidity, at many points in a storage area or chamber to show that it keeps products within their specified range. It is a key step in the GMP qualification of warehouses, cold rooms, freezers and stability chambers.
Our webinar Mastering Temperature Mapping drew a wealth of questions from quality and validation professionals worldwide. Here are 73 answers, grouped into seven topics, from Paul Daniel, Vaisala’s Senior Regulatory Compliance Expert.
01. Temperature mapping frequency and requalification
1.1 How often would you recommend mapping a storage area? Quarterly, annually, or every second or third year?
You typically map a storage area once at the start of its life, as part of commissioning or validation. After that, remapping usually happens every 1 to 5 years, depending on what you store and how critical the application is.
- Low-risk storage, such as a refrigerator holding inexpensive lab reagents, can often be remapped every 5 years
- High-risk storage, such as a stability chamber, warrants mapping every year, or even every 6 months
Practice is also shifting. Instead of a fixed cycle, you can run a periodic review of unit performance to decide when remapping is needed and how extensive it should be in terms of sensors and duration.
1.2 There are many differing standards for mapping frequency, from once at qualification to biannual or 4–5-year intervals. What frequency do regulatory agencies expect?
Regulatory agencies don't expect a specific frequency. They expect a sound rationale for the frequency you choose.
Start with the basics and map the unit once up front. Current thinking favors periodic reviews of unit performance to decide when you should remap. That approach requires monitoring, calibration and maintenance records, plus a defined way to judge when the combined evidence calls for remapping.
Some organizations find it simpler to map on a fixed annual cycle, and some consider annual mapping of every refrigerator worth the investment. The choice is yours. Whatever you decide, document it, so your rationale is ready when an auditor asks why and when you map.
1.3 What about periodic requalification of storage equipment when nothing has changed in our controlled temperature chamber?
Periodic requalification is still needed. Even without any formal changes, your controlled temperature chamber changes every day as it ages:
- The compressor wears
- Insulation becomes less effective
- Door seals wear and let in more warm air
- Control sensors drift and get recalibrated
These gradual changes are the reason to plan for periodic requalification. Initial validation alone is not enough. You should either remap periodically or, at a minimum, re-evaluate the unit based on its past performance to determine whether a remap is necessary.
1.4 Which parameters should we consider in our risk-based approach to justify the frequency of our qualification process?
For detailed guidance, refer to the ISPE Good Practice Guide: Controlled Temperature Chambers. In your periodic review, look at the operational history of the unit, including:
- Alarm reports and monitoring data
- Preventive maintenance, calibration and repair records
- Known issues with similar makes and models
- The criticality or value of the items stored
Together, these records give a cohesive picture of the unit's history and support a reasonable conclusion about its future performance. Because this approach is still relatively new, no specific standard defines it yet. Define your criteria, support them with data and apply them consistently. If an auditor does not accept your justification, be prepared to remap.
1.5 For a storage warehouse or secondary packaging room that has maintained a consistent thermal profile over multiple annual remappings, what level of documentation is required to justify reducing the frequency or scope of future mapping studies?
Use a documented periodic review of the area's performance. Your review should:
- Reference the successful historical remapping studies
- Verify that no significant changes were made to the area
- Include monitoring data showing the area is typically under control
This evidence is enough to justify reducing the scope of future mapping. The key is to make periodic review the first step of your remapping process. If the review is successful, the outcome is to defer mapping until the next review.
1.6 One challenge we face with auditors who want year-over-year mapping is avoiding product risk while getting mapping sensors into freezers that contain client product. Any thoughts?
You have two practical options.
The more resource-intensive option is to transfer all the contents to a spare freezer and map the empty unit. You can also use that downtime to perform maintenance or a manual defrost.
The faster, lower-cost option is to map the freezer with the product in place. Loaded mappings are an established practice, and an experienced mapping professional can place sensors without exposing the product to thermal risk
02. Planning a temperature mapping study: duration, timing and load
2.1 You indicated that the size of a unit could determine the length of a mapping study. Why base it on size? Shouldn't it be based on collecting enough data to show consistent and repeatable operation, regardless of unit size? Likewise, shouldn't the sampling interval be based on the potential for change over time, since less frequent data collection could cut peaks and valleys out of the data profile?
Mapping duration generally follows the size and complexity of the space. An ultra-low freezer usually sits indoors in a controlled environment and opens only a few times a day, so its conditions stay static. A 48- or 72-hour study already captures plenty of data. Sample intervals of 5 minutes are more than sufficient, because air temperature in a closed unit changes slowly.
A warehouse is different. Large doors open frequently, operations shift with work schedules and weekends, and outside walls, windows and doors expose the space to weather.
As a rule of thumb, capture two or three full duty cycles: about 2 weeks for a warehouse operating Monday to Friday, about 2 days for a freezer. Unique spaces may still need a custom duration and sampling frequency.
2.2 What do regulations say about sampling frequency?
Most regulations do not specify a sampling frequency. They focus on storing your product in a suitable environment that protects its quality, and some require you to map.
For practical direction on sampling frequency, look to guidance documents instead. Useful references include:
- ISPE Good Practice Guide: Controlled Temperature Chambers
- WHO Technical Report Series, No. 961, 2011, which WHO makes freely available
2.3 What does WHO say about mapping duration?
WHO covers mapping duration in Technical Supplement 8, Temperature mapping of storage areas, which supports Annex 9 of WHO Technical Report Series No. 961. It recommends:
- At least 7 consecutive days for warehouses and other ambient storage areas, covering both working days and weekends
- 24 to 72 hours for cold rooms and freezer rooms, or longer if justified
WHO makes this guidance freely available, so you can review the full recommendations yourself.
2.4 Is there a specific time frame for performing temperature mapping in winter and summer? Is it a requirement to perform both?
Seasonal mapping applies to warehouses and other controlled spaces that are not located inside another controlled space. Refrigerators or freezers in uncontrolled areas may need it too.
You generally need to perform both. If your local climate never reaches one of the seasonal extremes, document this in your rationale.
Aim for the coldest and warmest periods of the year. Use historical climate data for your area: if January is typically coldest, plan your winter mapping for January and include this data in your rationale. If you miss the extreme, you can repeat the study when a cold snap approaches.
Continuous mapping, with mapping sensors permanently in place, lets you map retrospectively. Learn more: Continuous mapping: better data, better compliance
2.5 When scheduling mapping for a large ambient warehouse, how do you choose the appropriate weather for the target testing window? Do regulators accept artificial thermal loading, or is it strictly mandatory to wait for peak external weather extremes?
Base your schedule on historical climate patterns and document your rationale in the protocol. A longer study improves your chances. If the coldest weather usually arrives in January, mapping for a month gives you a better chance than mapping for a week.
Artificial thermal loading, such as adding heaters or changing the setpoint, is creative but not predictable. You cannot reliably show that these actions on a 5 °C day simulate a 0 °C day, so mapping during real seasonal conditions is the more reliable approach.
To be sure you capture the most extreme weather, consider continuous mapping: a high-density monitoring program keeps sensors in place year-round, so you can map retrospectively. Learn more: Continuous mapping: better data, better compliance
2.6 For warehouse mapping, do we map with stored products in place, and how much stored product is required in the warehouse during mapping?
Ideally, you would map a warehouse both empty and loaded, during the hottest and coldest parts of the year. In practice, this rarely happens. Most warehouses go into operation before mapping, so you map with the load that is present.
Unless you can dictate the loading, focus on documenting it:
- Ask the warehouse supervisor for loading statistics
- Place your sensors and photograph each location to record the nearby load
- Run your study
If you do have influence over the load, use historical loading records to set a realistic target that reflects typical operations. For smaller units such as freezers or cold rooms, simply document the load you find.
2.7 For a large warehouse (more than 3,000 pallets), it is not possible to fill the warehouse with dummy loads for PQ mapping under full load. What is the best practice for simulating a full load?
No established best practice exists for simulating a full load in a large warehouse. Filling thousands of pallet positions with a dummy load, such as empty boxes, is rarely reasonable, even at 50%. In practice, you usually map with the load present when you have the opportunity.
Full and empty mapping fits smaller controlled temperature chambers better, where a dummy load is at least practical.
One approach is to wait until the warehouse holds a full load of actual product and map then. With the mapping sensors in place, you are unlikely to put product at risk, and your empty mapping already shows how the warehouse performs. If the loaded study reveals an issue, you may need to adjust the setpoint or review air handling unit capacity.
2.8 For warehouse temperature mapping, do we need to consider both static (at rest) and dynamic (in operation) conditions?
Yes. Your warehouse stores product both while people are working and while operations are paused. Each condition creates a different environment for your product, and there is no good reason to leave either one out.
Map both static and dynamic conditions so your data reflects every state in which you store product.
2.9 Unlike closed storage units, packaging rooms involve active operations. Should temperature and humidity mapping be conducted strictly under empty/static conditions, or do regulators increasingly expect loaded/dynamic mapping while packaging lines are running?
Regulators expect you to protect the quality of your product, so base your approach on how long, and under what conditions, product stays in the room.
If you store product in the packaging room while equipment is off, include empty/static mapping in your approach. Whether you also map during equipment operation depends on how long product stays in the packaging room.
Your organization has likely already studied how the packaging process affects product quality. Use that study as your reference to decide what mapping you need.
2.10 During a door opening test, should the curtains be kept open or closed?
Door opening tests are most common on smaller chambers without air curtains. Air curtains usually indicate a larger space with big doors for people and forklifts, such as a warehouse, where an open door test may not be meaningful. A major warehouse door should have a sensor that notifies key personnel when it opens, and it is hard to leave open unnoticed. On a small freezer, a door that is not fully closed can easily go unnoticed.
If you decide the test is meaningful for your space, the worst case is likely the curtain open. Verify that an open door with an open curtain represents a typical failure mode for your space.
2.11 Some users are concerned that air temperature does not provide meaningful results for door opening and power failure studies, because the worst-case challenge leaves limited time to react. How would you address this?
Door opening and power failure studies have no acceptance criteria, so they are not validation tests in the strict sense, and air temperature data from them has limited value.
For more meaningful data, perform these tests while monitoring product temperature. Companies often use this data to justify temporary excursions based on how long a power failure or open door lasted, and product temperature supports that decision far better.
You can also reduce these risks directly:
- Install a backup power source
- Train staff and use door closing mechanisms
- Place a monitoring sensor where it detects an open door
2.12 When mapping walk-in cold rooms, defrost cycles and frequent door openings often create shortterm thermal spikes. What is the accepted baseline for distinguishing a normal operational excursion during a defrost cycle from a failure against the mapping acceptance criteria?
Auditors expect you to differentiate between a defrost cycle and an operational failure. Start by mapping the unit and evaluating the data. You may not have a problem at all.
Keep the door controlled during the study with a lock or an access log, so a temporary spike points to defrost. Check the equipment manual or ask the vendor what triggers defrost and how long it lasts.
If you find an issue, typical mitigations include:
- Adjusting defrost duration or frequency
- Limiting door opening duration and frequency
- Restricting certain areas from product storage
- Specifying product size or packaging that resists air temperature changes
Guidance does not define a fixed baseline, so share your data with QA, who makes the final decision.
2.13 For a -20 °C freezer whose defrost cycle (up to 10 °C) goes beyond the -15 to -30 °C range during temperature mapping, what approach or strategy should we take?
Map the freezer first and use the data to characterize the excursions that the defrost cycles cause. Then provide the data to QA, who decides whether the regular defrost excursions pose a risk to the quality of the stored product.
You cannot take meaningful action until you know the extent of the issue, and the result may well be acceptable. QA may ask for more or different data, such as product temperature measurements, to support their decision.
2.14 For a temperature and relative humidity mapping study of a stability room, which worst-case scenarios should be identified and evaluated?
Stability rooms and chambers are among the most important spaces you can map. They have the tightest control levels, typically ±2 °C and ±5% RH.
These tight criteria act as a proxy for worst-case scenarios. If your room meets them, you can be confident it has the performance to handle unexpected issues.
Beyond that, evaluate the typical worst-case tests:
- Door opening
- Power failure
03. Sensor placement and density
3.1 What is the recommended minimum number of sampling points inside a chamber?
The minimum is 9 sensors for a space under 2 cubic meters and 15 sensors for a space between 2 and 20 cubic meters. You assess larger spaces case by case.
Treat these numbers as a floor rather than a target. The models behind them assume a perfect cube, yet a real refrigerator or chamber has shelves, corners and other features that shape how air moves. In practice, using 15 or 16 sensors in an average refrigerator gives you a more complete and compelling mapping study.
3.2 For controlled temperature chambers under 2 cubic meters, the ISPE model suggests a 9+1 sensor setup. How aggressively should we adjust that number if the unit has severe, known airflow restrictions or non-standard shelving?
Adjust upward with confidence. The ISPE model of 9+1 sensors suits a small unit shaped like a simple cube. Apart from some incubators, most units are more complicated, and restricted airflow or non-standard shelving adds to that complexity.
For these units, a starting point of 15 sensors is a better choice than 9. Auditors generally accept using more sensors than the minimum. The main trade-off is cost, since you will need a larger budget for mapping equipment.
3.3 In a 15+1 sensor setup, what does the plus one mean?
The +1 is one additional mapping sensor on top of the base configuration. You place it directly next to the monitoring system sensor, if the unit has one.
If the unit has no monitoring system sensor, place the additional mapping sensor next to the display sensor built into the controlled temperature chamber instead.
3.4 If you were mapping a fridge or freezer with five, six or seven shelves, would you recommend placing sensors on every shelf? Or would this follow a similar risk-based approach of reducing sensors, as in the warehouse lattice example? Or would the advice vary depending on the type of shelf, for example a solid shelf or a wire shelf that allows airflow?
Shelf type is the deciding factor.
- Solid, fixed shelves: use a higher sensor density and aim for at least two sensors on each shelf
- Wire, adjustable shelves: treat the unit as one open area and apply the risk-based lattice approach from the warehouse example
With wire shelves, you can reduce the number of sensors in the same risk-based way you would in an open warehouse.
3.5 How many sensors are needed if a freezer is divided by a shelf into two parts of 1 m³ each?
It depends on whether the shelf blocks airflow.
- Solid shelf that blocks airflow: treat each section as a separate space, with at least 9 sensors in each part
- Wire shelf that allows airflow: treat the freezer as one space, with at least 9 sensors for the whole unit
Treat 9 sensors as a minimum. Add sensors where shelves, corners or airflow make the space more complex.
3.6 What do you recommend for securing a sensor away from the walls to allow for space? We currently use VL-2000 data loggers and attach them to the wall with Velcro.
Velcro usually keeps the sensor too close to the wall. Most units heat and cool with airflow, so you need to leave room for air to circulate. An older standard defined this edge space as 10% of the total dimension: in a unit 1 m wide, the sensor sits 10 cm from the wall. The latest ISPE guidance shows this in a diagram, using the data logger position to mark the limit of the unit's working area.
- Lower corners: set the logger on something lightweight and breathable, such as a plastic basket
- Upper corners: hang the logger from the ceiling, raise a shelf and use a basket, or attach a small 10 cm (4 in) shelf support to the wall
3.7 When placing probes at the extremes, such as the very top level of a reach-in freezer, is there a best practice for getting the probes where they need to be, since they can't hover in the air and you wouldn't want a support structure to affect the measured temperatures?
Use a support with minimal mass that blocks as little airflow as possible. Practical options include:
- If a shelf sits at the right height, place the data logger directly on it
- If the shelf is too low, raise the logger on a lightweight object that does not obstruct airflow
- Hang the logger from a wire armature attached to the built-in shelf supports
- Fit small shelf brackets to the unit walls to hold the logger in place
Choose the option that puts the sensor where you need it while disturbing airflow in the unit as little as possible.
3.8 Airflow in walk-in chambers can be troublesome in the corners above the supply fans. Is it reasonable to modify sensor placement to better fit the usable space of the chamber?
Yes. You only need to map the parts of the space you will use for product storage. If preliminary studies show that some areas, such as the corners above the supply fans, are unlikely to pass, you can decide not to use them for storage.
This is a procedural control, and it needs follow-through. Support it with clear signage and documented standard operating procedures so no one stores product in unmapped areas by mistake. You may also need physical measures, such as removing upper shelves from racks or fitting protective grilles over the front of upper shelves.
3.9 In a controlled temperature chamber, can you define a working area that does not follow the 10% measurement distance rule? Corners, particularly upper corners, can be difficult to control and may not be a practical or relevant space to use.
Yes. Guidance gives you a general direction, and you define the working area that fits your unit and how you use it.
If you want the working area to extend closer than 10% of the dimension from the walls, support that decision with data first. A loaded mapping study can show whether the unit still performs with a smaller margin, for example 5%. Without that evidence, keep to the 10% distance.
3.10 Is there a general rule of thumb for rack depth that determines when sensors need to be placed inside the rack rather than on the face of the rack?
Map the places where you store product. Because product usually sits inside the racks rather than in front of them, place the sensor about halfway back into the rack.
Treat this as the ideal. In practice, you will need to adapt it to the mounting options available for your data loggers. You are unlikely to see a meaningful temperature difference across about 60 cm (2 ft) of rack depth in a warehouse. The exception is a spot next to a localized heat source, and that spot is a poor choice for storage in the first place.
3.11 What if we are talking about a really big warehouse, such as 50 x 30 x 15 m, with six shelves stacked vertically? Would we place sensors on every shelf, or is 3 x 3 enough for each side of the cube?
Divide the warehouse into 6 adjacent cubes, each about 17 m x 15 m in floor area, and give each cube 15 sensors. Where two cubes share a side, they can share the sensors on that side.
Using the stacks of three model from the webinar, this means 7 stacks along the long side and 5 along the short side. Then remove alternating sensors to reach your final layout.
3.12 At what level should the loggers be placed during a mapping study?
Place loggers at the level where you store product. If product sits 30 cm off the floor, place a logger at 30 cm. If product sits 6 m high, place a logger at 6 m.
Guidance documents differ on the number of vertical levels. WHO recommends dividing the warehouse height into 4 equal levels, while ISPE guidance appears to suggest that 3 levels are sufficient.
3.13 Can you explain the rule for removing alternating sensors?
Picture placing sensors in stacks of three. Fill a cube with 9 of these stacks and you have 27 sensors.
Now compare that with the recommended layout for a space of 2 to 20 cubic meters, which uses only 15 sensors. You get from 27 to 15 by removing alternating sensors. It is a simple rule you can work out in your head.
3.14 Can you place a Vaisala MI70 with an HMP77B probe in the controlled space during mapping as a check against the mapping sensors?
Yes. You can perform a point-of-use check with a reference instrument, such as a Vaisala MI70 with an HMP77B probe, at any time during a mapping study. Its value is limited, however.
You should already have verified that your mapping sensors are calibrated and reliable before placing them. A mapping environment is also dynamic. Your mapping sensors share the same sensitivity, accuracy and response time, while a handheld instrument differs on all three and can disturb the environment. The readings will likely correlate, yet you won't know what drives the difference. You will only see matching readings when you compare both devices in a controlled environment with known uncertainties.
If you add this check to your protocol, you also need a convincing rationale for its acceptance criteria.
04. From mapping to continuous monitoring
4.1 Could you also explain the worst-case location?
Worst case is a validation concept. You test under the most challenging conditions, such as the biggest load, the hottest time of year or an open door. If your space succeeds under worst-case conditions, you have a high likelihood of success under better conditions. In a warehouse, the worst-case location is usually the spot closest to a door or an HVAC outlet.
4.2 How do you determine the hot and cold spots? Should we do a trial for a few hours or a day with more sensors to cover all areas?
You identify hot and cold spots by mapping the space and reviewing which locations run warmest and coolest. In most cases, you don't need a separate trial run with extra sensors. An experienced eye can also predict likely candidates before the study starts, such as locations in front of an HVAC vent, next to a door or beside a forklift charger. Place a mapping sensor at each of these locations so your study captures them.
4.3 When writing the final temperature mapping report, what is the best practice for documenting why specific hot spots or cold spots were identified? Do regulators expect an in-depth computational fluid dynamics (CFD) explanation, or is a concise empirical justification based purely on the logger data sufficient?
You don't need a computational fluid dynamics explanation. A concise, common-sense justification based on your logger data is enough. For the vast majority of hot and cold spots, the cause is obvious, such as proximity to a door, an air vent or heat-generating equipment. Record that cause clearly in your report. If a location runs too hot or too cold, the right response is to fix the underlying issue, not to explain it in more depth.
4.4 For pharmaceutical storage, if mapping identifies both a hot spot and a cold spot, which location should be prioritized for routine monitoring, the hottest spot or the coldest spot? What is the rationale for the selection?
It depends on the size of the unit, its temperature range and what you store inside. For small reach-in units, the most significant risks are a door left open, a power failure and a compressor failure. Sensor position only matters for detecting the open door. That's why common practice is a single monitoring sensor on the side wall, on the door-handle side, about 20 cm back from the front seal.
Larger units and warehouses need multiple sensors. Use a grid that covers all storage areas, plus sensors at the hot and cold spots identified in mapping, in line with guidance and auditor expectations. If a hot or cold spot sits so close to its limit that you expect it to go out of specification in normal use, fix the unit.
4.5 How do you statistically justify reducing the number of monitoring points after completing a temperature mapping study?
Treat this as a risk assessment based on your mapping evidence, not a statistical calculation. Monitoring naturally uses fewer measurement points than mapping. Once mapping proves a unit meets its acceptance criteria, place monitoring sensors where risk is highest. In a small freezer, that typically means one sensor on the door-handle side wall, about 20 cm from the door opening, to detect a door left open.
In a warehouse, combine a grid with hot and cold spot sensors, in line with guidance and auditor expectations. Practical rules:
- Mount sensors where you can service and protect them
- As a rule of thumb, keep every product within about 20 to 25 m of a sensor, adjusted to the temperature stability seen in mapping
- Place sensors near doors, at both high and low levels
- Add sensors at the hot and cold spots
4.6 How should you choose placement points for temperature monitoring? Should I select them from the entire dataset, or select hot and cold spots from individual layers and treat each layer separately?
Work from the entire dataset. Use the data to build a picture of the whole warehouse and where the hot and cold risks sit, then place your monitoring sensors near those spots. A warehouse is one environment, not a stack of separate layers. The layers simply reflect how you deployed the mapping sensors. That said, analyzing the data layer by layer is a novel approach, and you may find it reveals a useful solution.
4.7 For large storage warehouses spanning thousands of cubic meters, how do you justify the final sensor placement layout to an auditor, specifically regarding how seasonal extremes are accounted for when a mapping study can only be executed during a single two-week window?
Work with the time, equipment and budget you have, and build a well-reasoned rationale supported by data. A practical approach:
- Map with a high density of sensors to understand temperature variability
- Review the available infrastructure, such as power, network connections and columns
- Develop several grid options and select the one that best fits both the mapped temperature dynamics and the logistics of the space
- Add sensors at the hot and cold spots identified in mapping, in line with guidance and auditor expectations
Summarize your rationale as one number: the farthest distance of any product from a monitoring sensor. Adjust it as new data arrives. To capture true seasonal extremes, consider continuous mapping with a high density of monitoring sensors, so you can map retrospectively.
4.8 If multiple hot and cold spots are identified, can we select one or two and disregard the others for continuous monitoring?
Not necessarily. Investigate the temperature dynamics in the space to find the source of each hot or cold spot. If two hot spots share the same source, monitoring one of them is reasonable. If they have different sources, such as a door and an HVAC vent, monitor both. Base your decision on the cause of each spot, not just the number of spots.
4.9 What if the shelves are about one or two meters away from the door? Would there be a reason to map the position closest to the door as a location for a monitoring sensor?
Place your monitoring sensor on the storage shelf, as close to the door as is reasonable. There is no reason to monitor a location where you don't plan to store product. This approach keeps the sensor where your product actually sits, while still positioning it as near as practical to the door.
4.10 When placing the permanent monitoring probe after mapping a walk-in cold room, what is the best strategy if the identified cold spot is located where a product shelf physically cannot go?
Start by reviewing your mapping plan. Mapping sensors belong in locations you actually use for product storage, so a cold spot in a non-storage location suggests the sensor placement needs another look. If the situation does arise, default to the next coldest location within your storage area for the permanent monitoring probe.
05. Acceptance criteria, excursions and calibration
5.1 If you allow excursions in your acceptance criteria, how do you justify that a system is in control if there are repeated excursions?
Your mapping acceptance criteria should come from your organization's monitoring program, not be invented for the study. Most monitoring programs allow harmless excursions so that you don't have to raise a deviation every time one occurs. The USP definition of Controlled Room Temperature is a good example: 20–25 °C, with excursions allowed from 15 to 30 °C.
Those system specifications define the expected performance, and in doing so they define what "in control" means for that system. A system can therefore stay in control with excursions.
To address repetitive excursions, the specifications should also limit how often they can occur. Typical limits include a time period, such as once per 24 hours, or a recovery criterion, such as staying within specification for 4 hours after any excursion.
5.2 I map units for a drug company, and we currently have no temperature excursion limits. How detrimental are brief temperature excursions in terms of SISPQ (safety, identity, strength, purity and quality) impact?
Many GxP companies allow excursions, and the USP definition of Controlled Room Temperature does too. That tells you that in many cases brief excursions have minimal impact on product quality.
Physics supports this. Mapping measures air temperature, and a change in air temperature takes time to become a meaningful change in product temperature, especially if the product is liquid, packaged or high in volume.
The specific impact depends on your product, because temperature-dependent degradation pathways vary widely. Some cases are clear-cut. Certain refrigerated vaccines can lose 90% or more of their efficacy if they freeze, so for a 2–8 °C product like this, a low-temperature excursion that allows freezing destroys the product.
5.3 In a warehouse that stores products for multiple customers, how do we determine the acceptable temperature excursions, given that different products have different stability data?
Collect and review the specifications from every customer whose product you store in the warehouse. Then select the set of specifications that is the most restrictive and use it as the basis for your acceptance criteria. Different products have different stability profiles, so applying the most restrictive requirements means your mapping study demonstrates suitable conditions for all of the products in the space.
5.4 If a mapping study meets the temperature specifications overall, but a few sensors near a doorway or high-bay rack show brief excursions during normal operations, how do we document this as a pass with recommendations or an operational restriction without invalidating the entire study?
Start with your protocol. Check what it says about excursions in relation to your acceptance criteria.
If your data is good overall but you need to make procedural changes to the space, talk with QA. Document the issue in a deviation report. As part of resolving the deviation, you can apply a range of strategies, including operational restrictions.
Support any restriction with data. Show that the traffic or activity actually caused the excursions, and show that your recommended operational restrictions reliably reduce them. Evidence like this gives QA and auditors a sound basis for accepting the restrictions.
5.5 If a specific zone fails the mapping study, for example due to a localized hot spot, can we implement a minor corrective action, such as adding a baffle, redirecting an air diffuser or declaring a specific rack slot off limits for storage, and retest just that zone? Or does the whole protocol need to be re-executed from scratch?
Discuss the options with QA and document your decision in the deviation resolution. ISPE guidance supports mapping warehouses by zones where necessary, so you may be able to remap only the affected zone.
Keep the physics in mind. Heat has to go somewhere. A baffle or a redirected air diffuser may move the problem rather than solve it, creating a new hot spot nearby. Design your remapping strategy to detect that possibility.
5.6 What if a fridge passes its calibration but fails temperature mapping qualification? Does this mean the unit is defective?
It might be, but check a few things first. Calibrating a refrigerator usually covers its display sensor and perhaps its control sensor. That addresses the input to the control system, not the control system itself.
Before you conclude that the unit is defective:
- Verify the installation: level surface, proper clearance from adjacent walls and an intact door seal
- Perform thorough preventive maintenance and cleaning, for example to clear a clogged filter
- Have a qualified technician tune the PID control system, which changes how the unit responds to its control sensor
- Adjust the setpoint
Together, these steps may get your refrigerator to pass its mapping qualification.
5.7 In the acceptance criteria, what exactly does "all deviations have been resolved" refer to?
As you execute your mapping protocol, you may collect data that does not meet the acceptance criteria, or you may have to depart from the specified test procedure. Each of these situations requires a deviation.
For example, your protocol specifies 48 hours of mapping, but you actually map for 47 hours and 45 minutes. The study is probably fine. Still, you didn't follow the procedure, so you document the discrepancy in a deviation. Once QA reviews and approves your rationale, the deviation is resolved.
As a general principle in validation, you need to resolve all deviations before you can close the project.
5.8 If a mapping data logger fails, loses data or drifts out of calibration midway through a 7-day warehouse study, what is the generally accepted threshold (for example, a percentage of total sensors) for data loss before the entire mapping study must be aborted and restarted?
There is no generally accepted percentage. You define the threshold in your protocol acceptance criteria and support it with a rationale that reflects the reliability of your loggers.
For chambers mapped with 16 thermocouples, a 10% allowance means 2 sensors can fail. In a warehouse, logger failures usually come from physical damage, such as a drop from a high shelf or a forklift. Add extra loggers to your grid and set a lower percentage, such as 2% or 5%.
For example, if you need 350 loggers, place 375 and allow up to 8 failures, provided no two are adjacent and no more than 2 fail per zone. QA can review the rule before approving the protocol. The goal is efficiency, not cutting corners.
5.9 How can you justify a 10% failure rate for data loggers?
Consider the alternative: the cost of repeating a whole study because a few loggers failed. A failure rule protects your effort when a logger gets crushed by a forklift.
Make two simple changes to your mapping plan. Use 10% more sensors than you need, and allow failures only on non-adjacent sensors. The 10% rule applies mainly to controlled temperature units. With 16 loggers, 1.6 can fail, which rounds up to 2. Warehouses use far more loggers, so you can set the limit at 5%, or simply at 2 or 3 non-adjacent loggers.
Without this rule, you would still write a deviation for the failed loggers and justify that they did not affect the overall characterization of the unit.
5.10 Is the failure of contiguous sensors acceptable?
No. A failure allowance exists to protect your study from the occasional failed data logger. When adjacent sensors fail, you create large gaps in your data, and a study with big gaps in coverage is not worth protecting. Write this condition directly into your mapping protocol so that your failure rule permits only non-adjacent sensor failures.
5.11 Regarding the common 10% sensor failure threshold during long warehouse mapping runs, if a failed sensor happens to sit in a historically identified critical hot spot, does that automatically invalidate the study, regardless of the remaining 90%?
Only if your protocol says so. If you consider your historical hot and cold spots critical, write that condition into the logger failure rules in your mapping protocol. To reduce the risk of losing data at those locations, you can also place two data loggers at each historical hot and cold spot, giving you redundancy exactly where it matters most.
5.12 How do you assess the pre- and post-calibration of the sensors? Is it just the difference between both tests? Do you consider uncertainty? What about the nominal accuracy of the loggers?
In most cases, you accept the factory calibration certificate, or a certificate from a calibration laboratory working in line with ISO/IEC 17025, as evidence of accuracy. If that pre-cal is a true calibration with adjustment following an SOP, uncertainty and accuracy are already included.
Think of post-cal as a point-of-use check that the sensor is still accurate. Some companies keep long-term calibration records showing that their loggers remain within specification, which gives them enough confidence to skip post-cal. Without that confidence, perform one.
Keep it simple: place the loggers and a reference in an insulated box with equilibrated water bottles inside a refrigerator for 24 hours. Instruments pass post-cal if they match the reference within their own stated accuracy.
5.13 Is post-calibration mandatory, or is it an industry best practice?
What is mandatory is reasonable confidence that the data from your mapping study is accurate and reliable. Post-calibration has been the established way to provide that confidence for many years.
If historical calibration data shows that your loggers consistently remain within specification after a year of use, you may have enough confidence to skip post-cal.
Less robust loggers may require a post-cal to provide the same level of confidence. Choosing a high-quality data logger gives you more flexibility.
5.14 If customers cannot afford pre- and post-calibration of data loggers and accept the data loggers as "calibrated", is the mapping still sufficient?
Calibrated, accurate devices are essential for a meaningful mapping study. For a warehouse, ±0.5 °C is the minimum accuracy you need. That doesn't require expensive pre-cal and post-cal procedures.
For pre-cal, rely on the logger's original calibration certificate, provided it is still within its validity period. For postcal, develop a simple procedure that holds the loggers at a stable temperature alongside a more accurate reference. Place the loggers in an insulated box with bottles of water to stabilize the temperature, then put the box in the controlled temperature chamber at the use temperature. For a more formal example, see Supplement 10, WHO Technical Report Series No. 961, 2011.
With this approach, pre-cal and post-cal are cost-effective, even when you outsource mapping.
5.15 For controlled temperature chamber and warehouse temperature mapping (OQ and PQ), can singleuse data loggers be used? Do any guidelines state that all data loggers used must be postcalibrated, which would make single-use data loggers unsuitable?
Yes, you can use single-use data loggers. Guidelines expect confidence in the accuracy and reliability of your instrument data, and you need that confidence at the end of the logger's life.
You can establish it in two ways:
- Post-calibrate the single-use loggers. For a formal example, see Supplement 10, WHO Technical Report Series No. 961, 2011
- Ask your logger vendor for data on the typical stability of the logger at the end of its life, ideally showing more than 95% within specification for a sample of at least 1,000 units
Post-cal is one established way to gain confidence, not the only one. Data loggers designed for mapping give you more confidence from the start.
06. Humidity, guidance and special cases
6.1 Can you recommend any guidance on humidity mapping alongside temperature mapping?
Yes. Humidity mapping can be part of your temperature mapping qualification, and you should include it if your storage area has a relative humidity specification. Because relative humidity depends on temperature, the practices are essentially identical. Use dual-purpose data loggers that record both temperature and relative humidity. For guidance, see the ISPE Good Practice Guide: Controlled Temperature Chambers.
6.2 What is the typical or acceptable relative humidity range for pharmaceutical storage areas? Is there a general industry standard?
Start with the storage specifications for your product. If the product has no humidity specification, base your range on the requirement to protect the product and keep the storage environment clean. That means preventing mold and pests while keeping conditions healthy and comfortable for staff, so they can make good decisions. A commonly used range is 25% to 60% relative humidity. Below 25% or above 60%, people start to feel uncomfortable.
6.3 Does high altitude affect temperature mapping?
In practice, no. At any altitude where you would operate a pharmaceutical production or distribution facility, altitude has no real effect on temperature mapping. Air at higher altitude is less dense and often drier, and the climate is generally cooler. These factors can influence temperature dynamics and will affect your relative humidity measurements most. Even so, they don't change how you perform temperature mapping.
6.4 Can you shed some light on mapping automated storage and retrieval system (ASRS) warehouses?
Mapping an ASRS warehouse is not significantly different from mapping a conventional warehouse. An ASRS warehouse is still a temperature-controlled warehouse. The dimensions change somewhat, because a traditional forklift no longer limits retrieval. In some ways, an ASRS warehouse is easier to map, since you can use the system itself to place and retrieve your data loggers.
6.5 I have a controlled temperature chamber inside a cleanroom. Does the environment surrounding the chamber need to be qualified before the chamber study itself?
Technically, yes. In practice, an operational cleanroom that maintains temperatures around 20 °C won't present a meaningful challenge to the chamber. If the room is comfortable to work in, the surrounding environment is not a concern. When the cleanroom has an active monitoring system, include a copy of its data in your chamber qualification to show the environment was not an issue. Many chambers operate in temperature-controlled hallways or labs that are not mapped. You only have an issue if the cleanroom is not operating and temperatures exceed 25 °C.
6.6 When analyzing temperature mapping reports for storage areas that experience temporary temperature swings, such as warehouse loading docks or packaging rooms with frequent door openings, how strictly do auditors accept the use of mean kinetic temperature (MKT) versus absolute peak minimum and maximum temperatures to justify product stability?
Mean kinetic temperature (MKT) is not appropriate for evaluating mapping studies. MKT is intended for infrequent excursions in spaces that are already well controlled. When you map an area, you have not yet proven it is controlled. That is the purpose of the mapping study, so using MKT at this stage is premature.
Thermal damage is real and cumulative. If you don't know the entire thermal history of a product, you can't tell whether an earlier calculation already masked a significant excursion. Evaluate your mapping results against the measured temperatures and your acceptance criteria.
6.7 Is there any guidance on computational fluid dynamics (CFD) modeling versus actual mapping?
For most controlled temperature chambers, computational fluid dynamics (CFD) modeling is not practical. Building an accurate model takes considerable time, and you need precise variables for geometry and load. Units cooled by airflow, such as incubators, also need very different models from units cooled by conduction, such as ultra-low freezers. With so many different chambers, load patterns and environments on the user side, CFD is hard to apply effectively. It may suit niche cases, such as manufacturing a complex device that needs good temperature control.
6.8 For secondary packaging rooms where HVAC systems must manage high variability, human traffic and variable door openings, how do you recommend structuring the mapping protocol to isolate routine operational disruptions from systemic HVAC failure?
Don't structure your protocol around these disruptions. A room with high variability, heavy traffic, frequent door openings and HVAC equipment at risk of failure is essentially an uncontrolled system. You can't meaningfully map or validate an environment like that. Focus first on bringing the environment under control. Mapping before that point is unlikely to produce meaningful results.
6.9 Secondary packaging rooms are heavily influenced by HVAC adjustments for operator comfort. How do you handle mapping in rooms where relative humidity fluctuates rapidly due to high personnel traffic and localized equipment heat loads?
Start by asking how long product stays in the room. If it is only a few hours and you already control conditions for employee comfort, a risk assessment may show that mapping the room is not necessary. Secondary packaging is a process, not storage, so changing setpoints and heat-generating equipment are part of normal operation. Your product also keeps the protection of its primary packaging, which you can account for in your risk assessment. If you decide mapping is the right strategy, consider placing sensors inside the primary packaging to see the conditions your product actually experiences.
07. Protocol execution and documentation
7.1 If a temperature mapping study reveals that a warehouse or cold room cannot physically meet its historical validated range because of severe seasonal ambient shifts, rather than an equipment or operational breakdown, what is the expected regulatory sequence for executing a change control to safely adjust the storage range versus making an HVAC capital upgrade?
Temperature specifications are rarely negotiable, so a warehouse or cold room that cannot hold its range is a serious issue. Several strategies can help:
- Map product temperatures instead of air temperatures, with procedural controls requiring product to stay in its packaging
- Use seasonal setpoints, a lower one in summer and a higher one in winter
- Declare certain areas off limits for storage during certain seasons, enforced by procedural controls
Each of these changes your process, so each requires change control. A simple sequence: gather more data to decide which approach works, raise the change control, then adjust your monitoring to confirm the solution is effective. Seasonal weather shifts are here to stay, so plan for an HVAC upgrade as well.
7.2 If a facility is changed structurally between seasons, do we have to completely re-execute the entire protocol, or can a targeted requalification suffice?
Not necessarily. Start with a risk-based analysis of the impact of the change. The answer depends on the nature of the change.
For example, if you moved a row of shelves inward, you reduced the size of the conditioned space, and you may not need to remap at all. If you moved shelving outward, you increased both the space and the load on the HVAC system. In that case, you should remap at least the affected zone.
7.3 How thoroughly do validation packages need to link the sensor placement grid back to a formal quality risk management (QRM) document or FMEA? Is a standard textual justification in the protocol enough, or do inspectors expect a formal scoring matrix showing why certain racks or zones were chosen?
In most cases, a formal scoring matrix is not required. A clear textual justification in the protocol is sufficient to explain why you chose specific racks or zones.
To make your rationale easier to follow, consider including a layout map that shows the racks, doors and HVAC supply points. Auditors can then see how your sensor grid relates to the features of the space.
Keep the justification proportionate to the risk, in line with your quality management system.
7.4 When executing mapping studies across complex spaces such as a large warehouse or cold room, minor layout changes or logger shifts often happen on site. What is the acceptable boundary for making field changes to a mapping protocol before they invalidate the pre-approval, and how strictly do auditors look for protocol amendments versus deviation logs?
Field changes are a normal part of protocol execution in complex spaces. Handle them through your quality system so the study remains valid and traceable.
If as-found conditions require you to move a data logger, make the change, document it and record the rationale. If you are unsure whether a change is acceptable, get approval from the protocol pre-approvers before proceeding.
Data integrity is the deciding factor. After the fact, an auditor should be able to understand what was done, why it was done, who did it and who approved it.
7.5 You highlighted that we should only map storage areas and exclude hallways. If operators routinely move product through transitional zones, how do auditors view the risk of those unmapped access corridors?
Moving product is a normal part of operations, and auditors understand that. The key is to move product promptly and never leave it temporarily stored in unconditioned, unmapped or unmonitored spaces.
Your risk depends on several factors:
- The storage specification of the material
- Conditions in the corridor
- The product's sensitivity to temperature change
- How you move it, for example in an insulated container
- How long the transfer takes
Moving product a short distance along an air-conditioned hallway on a hand cart is typically low risk. Moving a frozen item a long distance outdoors without an insulated container is not. Depending on your situation, this may be a non-issue or you may need to validate the transfer process.
Paul Daniel is the Senior Regulatory Compliance Expert at Vaisala. He has worked in the GMP-regulated industries for over 30 years helping manufacturers apply good manufacturing practices in a wide range of qualification projects. His specialties include mapping, monitoring, and computerized systems.
At Vaisala, Paul oversees and guides the validation program for the Vaisala Viewlinc Continuous Monitoring system. He serves as a customer advocate to ensure the Viewlinc matches the demanding requirements of life science and regulated applications.
Paul also shares his GMP experience through regular blog contributions, webinars, and seminars around the world. Paul’s expertise in the demanding GxP world is applicable to any industry where measurement is critical to product quality. Paul is a graduate of University of California, Berkeley, with a bachelor's degree in biology.