Seasonal forecasting of renewables: How to win at the Roulette table?


Renewable energy owners, operators, and their shareholders are naturally curious about how their wind or solar production will turn out next month, next quarter, and next year. They want to know how individual assets might be impacted by abnormal weather patterns and what it means for their aggregate portfolios. They already have to anticipate whether or not plant availability and performance will meet expectations, which is difficult enough due to all the uncertainty associated with various weather, performance, engineering and operations factors that must be quantified to set those expectations.
Forecasting the whims of mother nature months ahead of time adds a unique additional complication, another twist on that uncertainty, but one that manifests itself differently month after month. So owners are left wondering, do we expect to have above or below normal wind and solar resources at each facility? Will it turn out to be a booming quarter, or will it become the worst ever over a broad area negatively impacting many assets, like winter 2015 for wind power in the USA (Figure 1)?
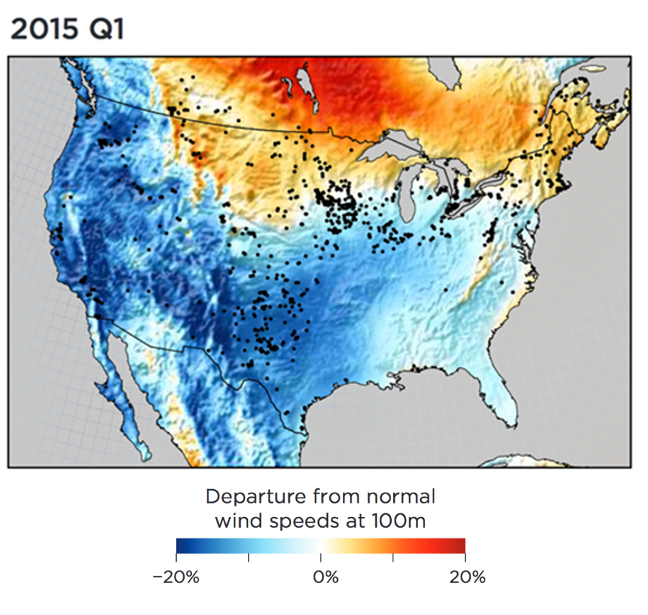
Figure 1. Estimated departure from normal for 100m wind speeds across the Continental US
from 2015 Q1 (Jan-Feb-Mar) with blues showing below average and red denoting above average.
Black dots represent operating wind projects.
Getting at least some indication of the possibilities can be key for properly managing risk, cash flow, or shareholder expectations. Increasingly, project owners are asking for help to see what can be done to anticipate wind and solar resource deviations from normal at seasonal time scales.
The game of Roulette makes an excellent analogy for what the industry faces as the production numbers from each new month come rolling in. The popular casino game is played by placing bets in different slots around a wheel that spins at a constant rate. A ball is dropped onto the spinning wheel and randomly falls into one of the slots. Each slot is marked with a number between 1 and 36, with half the numbers black and the other half red. For the purposes of our thought experiment here, let’s say that you can sort all the potential years of renewable energy production for the last 36 years from the worst (#36) to the best (#1). Or we could make the situation simpler by saying that black represents above average years and red represents below average. In the European version of game, there is one additional slot denoted with the number 0, and is neutral colored, to give the house the edge. To pick the winning slot is a 1 in 37 chance; you have less than a 3% probability of guessing the correct number. The renewable energy project operator may feel their odds are just as low (or worse) to correctly anticipate that quarter’s power generation in advance. Sometimes the weather pattern is so abnormal that it falls outside the range of the historical record. The American version of the game makes it even a bit harder, introducing an additional a double-zero slot that is also neutral, thereby reducing your odds further. This outcome also has a good link to our analogy. Coming up double-zero is sort of like being exposed to a new record low.
Our challenge then might be to correctly pick the most similar past year ahead of time, or more simply, to correctly guess above (black) or below (red) normal conditions. For example, it could be most similar to what happened back in 2016 (like #36 on the Roulette wheel), or 2005 (#25), or even 1988 (#8). The idea is that if the observed data record is long enough, one can use the actuals from these past years to make forecasts for the upcoming one. Weather and climate forecasters call these “historical analogs”, and choosing this approach is a popular way to make a seasonal prediction that attempts to beat the long-term average. To apply the analog forecasting technique for renewable energy projects with only a few short years of operating records, it first requires creating a multi-decade proxy for the wind or solar resource at each location. We need at least a simulation of the project had it been operating that long ago. The tricky part then becomes how to guess with any skill as to which historical years will be most similar.
A gaming approach to communicating seasonal forecasts and their efficacy is not a new idea. In fact, the concept of Weather Roulette was recently highlighted in the Bulletin of the American Meteorology Society's October 2019 issue [1] and can be traced back to a presentation at the European Centre for Medium-Range Weather Forecasts (ECMWF) Users Seminar in 2002 by Mark Roulston and Leonard Smith. To a renewable energy project owner, it might be clear that they are sitting in the casino playing Weather Roulette. It may not be so obvious that seasonal forecast services are now available to effectively tilt the Roulette wheel and increase the odds of winning the game. At Vaisala, we combine global climate indices and state-of-the-art climate predictions with a machine learning approach to forecast 1-12 month ahead wind and solar deviations for use in managing your risk exposure. At present, there are places and times of the year where this works pretty well and the above/below normal category accuracy can be increased from an unskillful 50% to the 70%-80% range. Try out this service through our Energy Budget Outlook tool as a way to maximize the return ratio on your renewable energy investments.
Reference:
[1] Terrado, M., L. Lledó, D. Bojovic, A.L. St. Clair, A. Soret, F.J. Doblas-Reyes, R. Manzanas, D. San- Martín, and I. Christel, 2019: The Weather Roulette: A Game to Communicate the Usefulness of Probabilistic Climate Predictions. Bull. Amer. Meteor. Soc., 100, 1909– 1921.