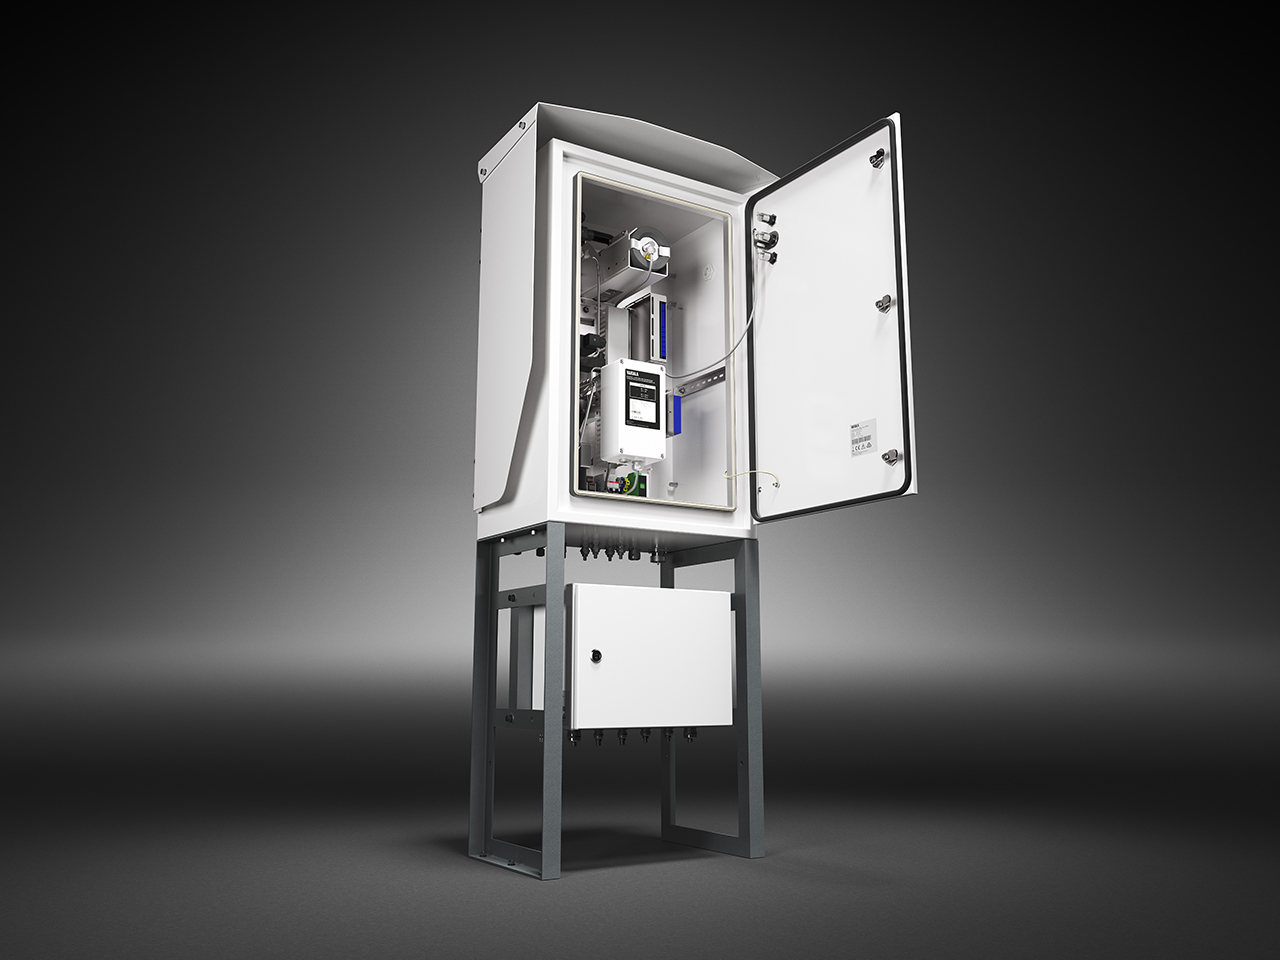
Using online DGA to safeguard a transformer's end-of-life operation
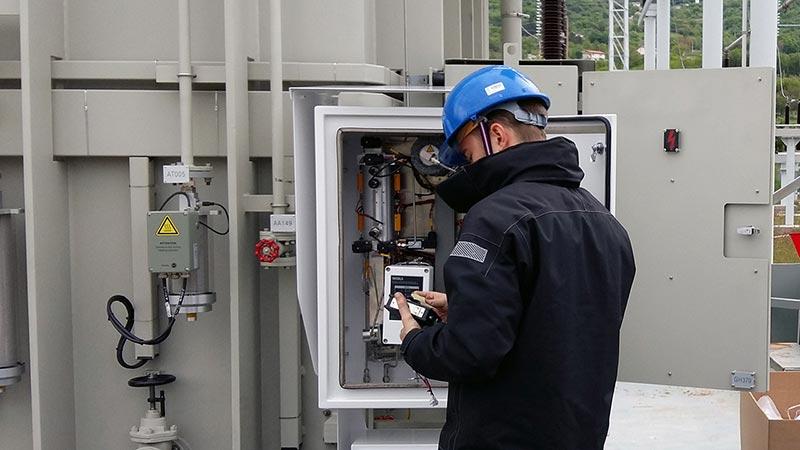


This customer case explores detection of severe faults, the overall monitoring process and procedure during an old transformer’s final months in service – its end-of-life. The case demonstrates how a utility was able to use Vaisala’s online DGA monitor to help systematically monitor, then validate the issue and replace the transformer before it experienced any major operational failures or expose staff to safety risk. Additionally, the case provides insight into how important keeping a transformer performing well through its end-of-life is, proving the return on investment from a real-time online DGA monitor.
Case history
This case is from a utility operator in the Southern US, involving a 100 MVA transmission transformer equipped with a preventive autotransformer (PA), manufactured by Pennsylvania Transformer in 1958. It was nitrogen blanketed with mineral oil insulation and an ONAN/ONAF cooling system.
The transformer operated without any significant issues for its first 50 years, until 2010, when the first gassing patterns appeared. The situation remained stable until 2013 when an unknown event caused significant gassing. In just a few weeks, e.g. ethylene increased from 35 ppm to 100 ppm.
Based on the gases formed, only a high temperature fault in oil was initially suspected. It was not considered to be a dramatic fault, that is, not related to the transformer’s windings. It was clear that paper was not involved, as there was no significant increase in carbon monoxide, carbon dioxide or ethane found in the DGA analysis. The transformer was set under more frequent DGA follow-up and the situation again stabilized. No gassing was observed until later in 2017 when a new significant gassing event was observed, which later again stabilized.
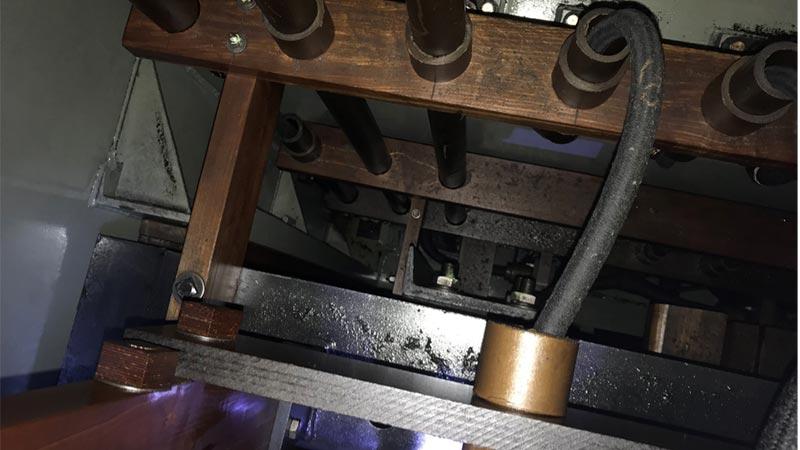
In the Autumn of 2018 the transformer was relocated, and its oil degassed. The first problematic DGA sample at the new location was observed in May 2019. Gas levels continued to increase, and the transformer was powered off for closer inspection. At that point, the suspected faulty part was the preventative autotransformer of the LTC, sharing oil with the main tank. However, inspection with a scope revealed no visible gas sources. But even with the scope, visual access was very limited. Following inspection, the transformer was again energized, now without tertiary load. The gases remained low and stable for a few months, until October 2019. In early February 2020, the transformer was inspected again with the scope, revealing some clear carbon like debris which had settled on the PA surfaces (Figure 1).
Installing the online DGA monitor for deeper analysis
The challenge with the interpretation of the gassing and its severity over the last few years had been that the sampling frequency between the actual gassing patterns was impossible to achieve and maintain at a level sufficient enough to know the exact timing of the events. It was not possible to say whether the increase in gases was gradual or if it was a question of separate incidents. To get this information, the transformer was equipped with an online DGA monitor in October 2019. This enabled the utility maintenance team to more closely follow gassing and to ensure the safe use of the transformer until its replacement. Simultaneously, more frequent DGA samples were taken to evaluate the monitor’s performance.
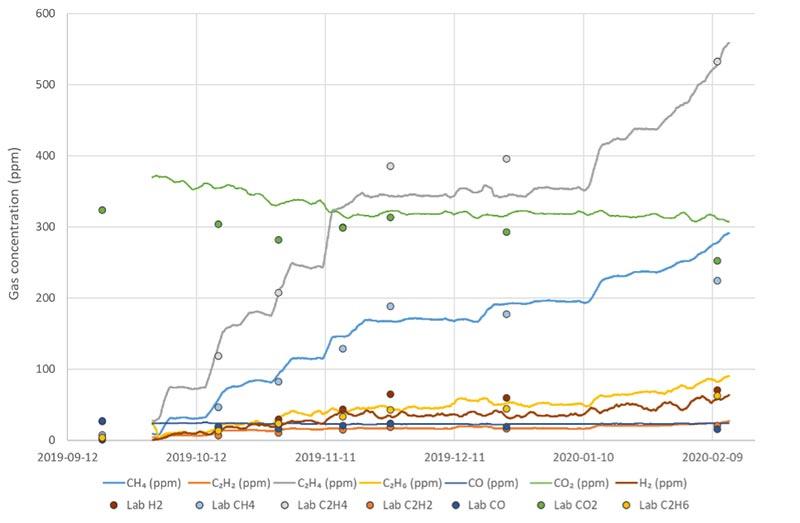
Interestingly, when looking at the online monitor data, it became clear that the gassing patterns were not a steady incremental increase, but started with clear steps. This suggested that it was a question of separate incidents. This was further supported by the results of comparing gassing to load; no correlation was observed. Of note in this analysis was that the transformer was handling a transmission task and thus the load was stable and rather low, only 40% of its name plate rating. This detail and analysis was possible because the online DGA monitor was giving real-time data (hourly).
“Replacement was already in our minds; we knew we had an issue, but samples were being taken every two weeks. Specifically, we had trending in acetylene gassing, which was assumed to be associated with the preventative auto within the transformer. We were able to demonstrate that the issue was evolving – and not steady state – and needed to be addressed sooner rather than later. Once acetylene production reached a certain point the asset was removed from service.”
Utility’s Support Engineer
Then in early January 2020 the OPT100 DGA monitor revealed that the gassing pattern again changed to a continuous and accelerated increase in gas formation — a clear indication that the fault was evolving and becoming more severe. Based on this condition – indicating a very high risk of imminent failure – the utility made the decision to remove the transformer from service permanently.
Diagnosis based on DGA
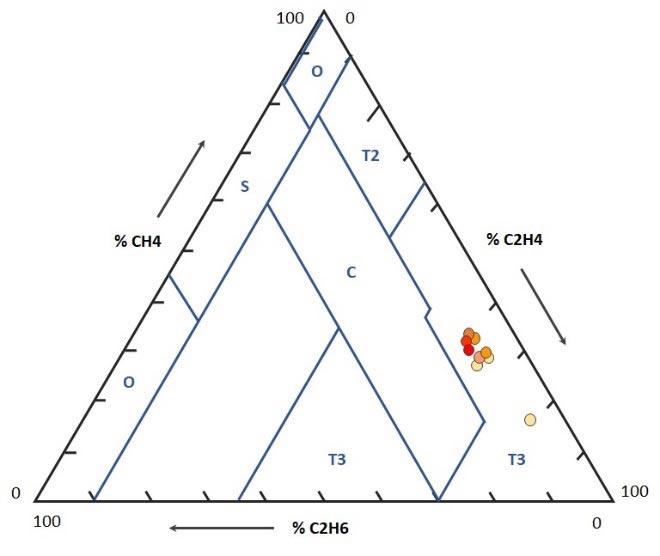
Like the earlier laboratory DGA results, the data from the online DGA monitor showed that the CO and CO2 levels remained stable through the entire monitoring period (Figure 2) indicating that insulation paper was not involved with the fault events. The dominating gas was always ethylene, which indicates a thermal fault. A more detailed analysis with Duval triangles and pentagons suggested a very high temperature fault, T3, in oil only (Figures 3 & 4).
Over the last 10 years some of the gassing could have been caused by lightning impulses or load on the line due to a fault as the timing matched with storms and the line was confirmed to have been struck. This hypothesis was supported by the fact that the secondary side of the PA was connected to an unshielded 69kV line.
However, the gassing events, especially the most recent ones which were timed and tracked by the online DGA monitor, had happened when there was no line fault or storms.
This was a strong indication that there was an internal fault, and that it was evolving. Of note is that the online DGA monitor had been the key tool in determining this.
| % CH4 | % C2H4 | % C2H6 | Fault | Color | Date |
| 16.1 | 77.4 | 6.5 | T3 | 2019-10-03 | |
| 27.5 | 62.5 | 10.0 | T3 | 2019-10-15 | |
| 29.2 | 63.1 | 7.7 | T3 | 2019-10-30 | |
| 29.2 | 62.1 | 8.6 | T3 | 2019-11-11 | |
| 29.5 | 63.4 | 7.1 | T3 | 2019-12-16 | |
| 32.6 | 59.1 | 8.2 | T3 | 2019-12-20 | |
| 32.5 | 58.7 | 8.7 | T3 | 2020-01-10 | |
| 32.2 | 58.9 | 9.0 | T3 | 2020-01-17 | |
| 31.0 | 59.4 | 9.7 | T3 | 2020-02-13 |
Figure 3. A few DGA data points of the monitor showing the relative portion of methane, ethylene and ethane according to Duval triangle 5 during the monitoring period. Fault indication: high temperature thermal fault, T3.
"Postmortem” forensics
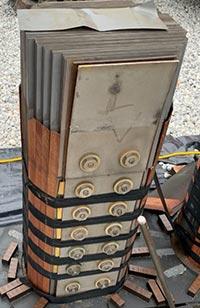
After the transformer was permanently taken out of service, its tank was opened and its internal parts thoroughly investigated. No obvious signs of overheating were found in the main active parts of the transformer, nor severe discoloration which would have been indications of paper degradation in the PA windings.
(Figure 5. The core laminations of the PA exposed during the postmortem. >)
The most significant signs of high temperature exposure were on the lower and middle parts of the wood spacers next to the core of the PA. There was severe carbonization on their inner surfaces, confirming that there had been several separate incidents, which were producing gases at different intervals, as shown in the DGA gassing pattern in the online monitoring data (see figure 2).

Wood carbonization and dominating ethylene gas together with increasing hydrogen and acetylene indicated a fault spot temperature over 700°C. Considering the decades of this transformer in service without any known thermal issues, it was assumed that the recent gassing patterns indicated relatively quickly evolving faults that may have been initially induced by the earlier line faults downstream.
(Figure 6. Carbonization found on the surfaces of the wood spacers of the PA core. >)
Conclusions
While offline DGA sampling can identify potential internal faults, only continuous online DGA monitoring tools can both detect gassing in real-time and reveal the actual gassing patterns, and enable true fault identification and analysis. This information is critical for making timely maintenance action decisions. Such information is valuable to asset managers who need to know the technical life and current condition of the assets, and in particular if a fault requires immediate maintenance actions, replacement or if it can last longer. Even if the transformer remains in service, the maintenance team still benefits from online DGA fault monitoring by receiving real-time data regarding safe operation.
In conclusion, online DGA monitoring of transformers in their end-of-life or “active fault development” phases is a key tool to provide utility operators with peace of mind to safely use these transformers, until such a time when their repair is feasible or their replacement is required.