Where is each U.S. state’s lightning capital?
Vaisala released its Annual Lightning Report this week and it was our most comprehensive one yet! Be sure to check it out if you haven’t already.
Even though we included a lot of information in the report this year, it still doesn’t touch on everything we could talk about with respect to lightning. We included volcanoes but didn’t include thundersnow or hurricanes, for example.
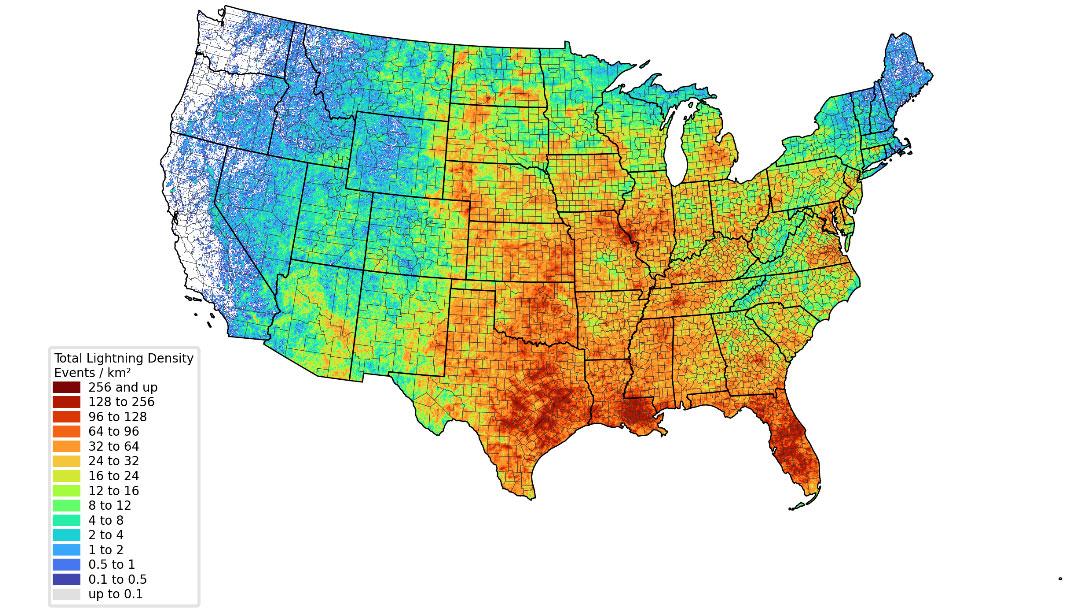
They say, “All news is local” and this is also true with respect to weather, so we thought we’d dive way in and see where each U.S. state saw the most lightning in 2021. As seen in the 2021 total lightning (in-cloud and cloud-to-ground) density map, lightning does not occur uniformly across the United States, or even across individual states.

2021 total lightning density for the continental United States. Each grid space is 2 km x 2 km.
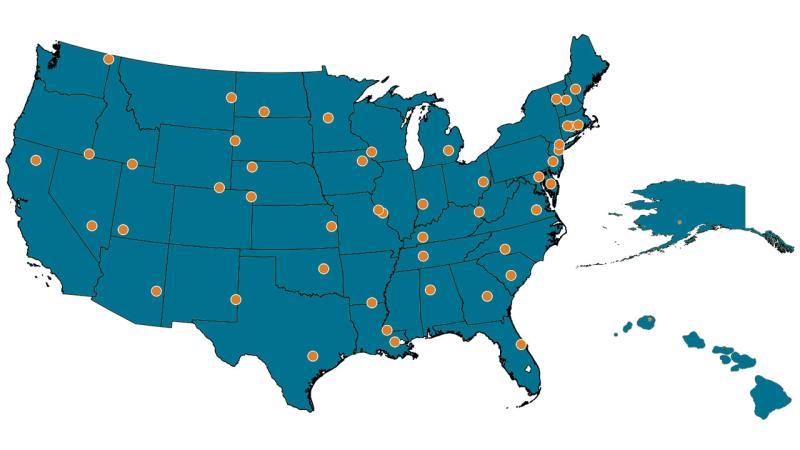
To identify each state’s lightning capital, we filtered the gridded density map to find the highest density grid cell in each state and identified the city or town the grid cell was associated with. Across the western United States, cities are spaced farther apart, and some of the capitals fell in unincorporated portions of counties.
The 2021 United States Lightning Capital
The city of Flatonia, Texas, earned the distinction of U.S. Lightning Capital for 2021, with 1,043 lightning events detected per square mile on the north side of town.
Hawaii’s lightning capital had the lowest lightning density – Kalihiwai checked in with 17 lightning events per square mile.
>>> Check the full list to see the lightning capitals of each U.S. state <<<.

