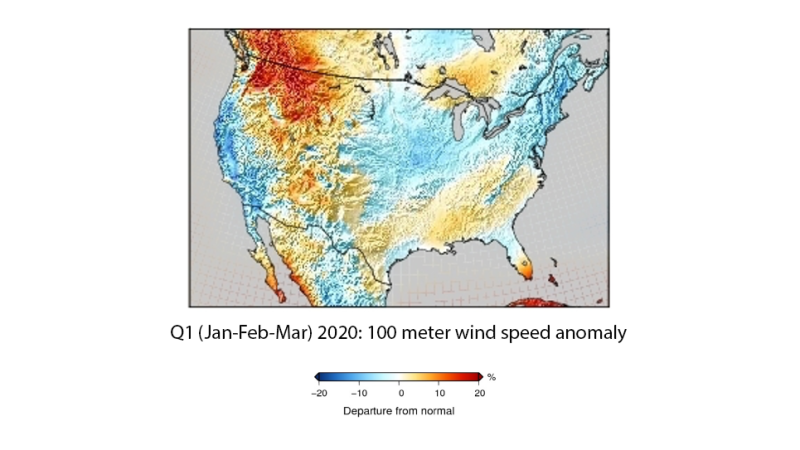
Q1 2020 CONUS Wind Resource Anomaly Analysis
The overall weather pattern over the Continental US in January was characterized by a high amplitude wave pattern aloft across the Northern Hemisphere. Upper level high pressure anomalies were observed over the Eastern CONUS and low-pressure anomalies over the Western CONUS. Resultant wind resource anomalies were positive for the Western US, Wyoming, and the Southern Plains due to the slightly stronger jet stream over the SW US. The remainder of the CONUS resource was either at or slightly below the long-term climate average.
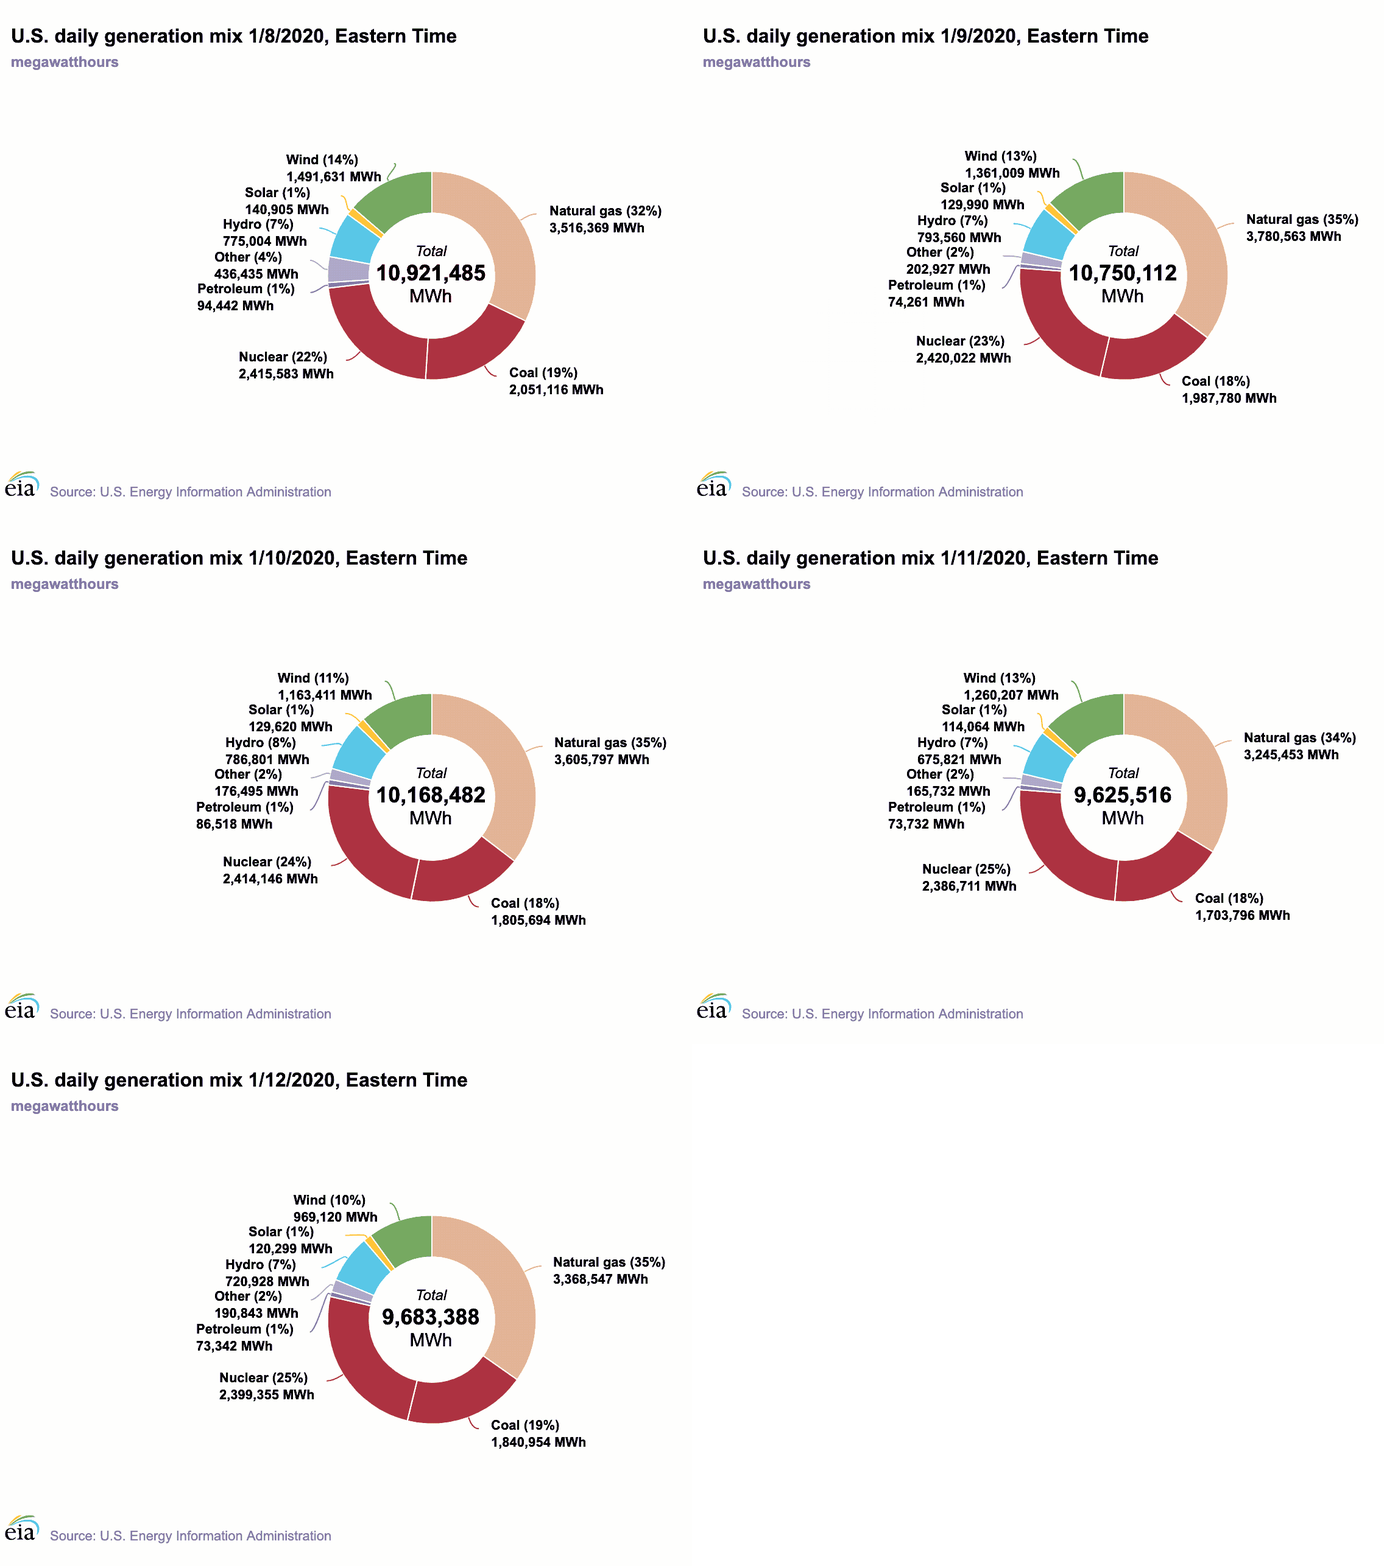
A period of note within the month was Jan 8-12. A strong surface low pressure system dug in over the Pacific Northwest while several potent cold fronts moved through the Plains and Midwest. Wind resource was plentiful across the entire US. Wind power accounted for more than 10% of total electricity generated each day during this time frame, as can be seen in the figure below [1].

The overall weather pattern over the Continental US in February was influenced by strong upper level low pressure troughing over the north and central states downstream of strong upper level high pressure ridging off the Pacific coast. This set up caused upper level high pressure anomalies over the east and west coast. Resultant wind resource anomalies were positive for the Rocky Mountain and Southeast due to the slightly stronger height gradients over these areas. The remainder of the CONUS resource was either at or slightly below the long-term climate average.
March weather over the CONUS was yet again influenced by a strong upper level high pressure anomaly over the Central Pacific. This allowed for colder air to spill west of the Rockies into California. Warmer air was in turn displaced north and east into the Midwest and Eastern CONUS. Wind resource anomalies were positive in the West, SE and East compared to the long-term climatology but at or below that elsewhere.
References 1. https://www.eia.gov/beta/electricity/gridmonitor/dashboard/daily_generation_mix/US48/US48

