Wind farm wake loss estimates: How are we doing?

Wind project energy yield estimates
At the end of 2018, wind energy accounted for nearly 5% of worldwide electricity generation, and new wind energy projects, both onshore and offshore, appear on the horizon seemingly all the time. Yet the decision about where to build a new wind project is neither random nor trivial. With potentially hundreds of millions of dollars of revenue at stake for a typical wind project lifetime, developers want to know how much energy their proposed project will produce before they build it. And so will anyone investing in their project.
Enter the “energy yield estimate”: a sophisticated calculation employing on-site wind measurements and wind flow modeling to estimate how much electrical energy the site will produce over the lifetime of the project. On the plus side of the balance sheet is the wind itself, and the ability of modern turbines to convert that raw power into electrical energy. On the negative side are the many ways that Mother Nature and the laws of physics act to reduce the energy yield: in other words, the “losses”.
Turbine wake loss estimates and validation
One of the largest losses is the reduction of wind speeds at downwind turbines due to wakes caused by upwind turbines. A wake is a cylinder of air downwind of a turbine in which the wind speed is reduced because of the wind energy that’s been extracted by the turbine. To explore all of the possible wake losses arising from hypothetical arrangements of the turbines at a proposed site, the wind development industry uses a variety of computer models, varying in sophistication, that calculate potential wind turbine wake effects and resultant losses in energy production.
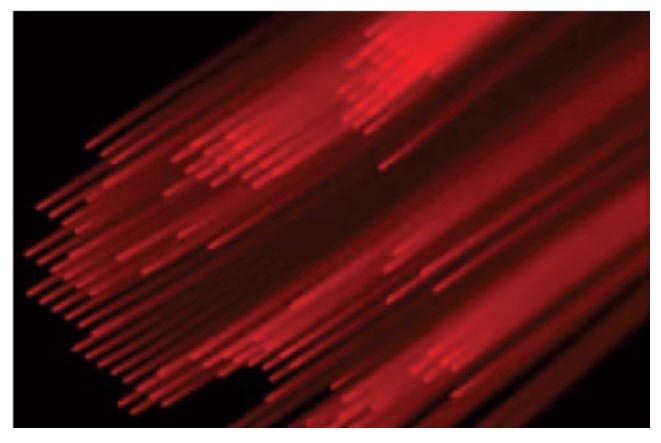
Reprinted from [1].
The figure at left shows an example of Vaisala’s modeled wind turbine wakes for a particular wind project. Many of these models have been validated against actual measurements, but typically only under idealized conditions. In the real world environment, where the prevailing wind speeds, directions, and atmospheric stability are constantly changing, the turbine wakes interact with each other in complicated ways; they are not isolated and steady. This makes them challenging to observe and expands the effort associated with validating their presence and strength. The difficulty of measuring real wakes to validate our models is compounded over land, where differences in the terrain cause even more variability across a typical wind project area, as the undulations and ridgetops create complex wind flow patterns that can conceal or scramble the turbine wakes. It’s like trying to listen to a conversation with the person across the table from you in a crowded restaurant; you have to separate out the voice you’re trying to hear from the rest of the background chatter.
Vaisala’s wake loss validation study
Not ones to shy away from these challenges, Vaisala recently conducted a validation study of its wake loss estimation methods at seven onshore wind projects over the central United States. The operating projects ranged in size from “medium” (60 MW installed capacity, or enough to power approximately 14,000 homes) to “large” (500 MW installed capacity, or enough to power approximately 120,000 homes), and were all located in what most people would describe as nearly flat terrain. However, even subtle terrain features can produce spatial patterns of wind that make turbine wake analysis difficult. The common pattern we observed was wind deceleration on the windward sides of subtle terrain prominences, and acceleration on the downwind sides. All the projects we studied were built on and around such subtle terrain prominences, and this terrain-induced pattern exactly countered (and sometimes exceeded) that produced by the wakes themselves. It was not until we accounted for the terrain effects, and removed their signal, that we could obtain a clean and isolated wake loss signature. From here, we could run our wake loss model and make a true comparison.
Study results
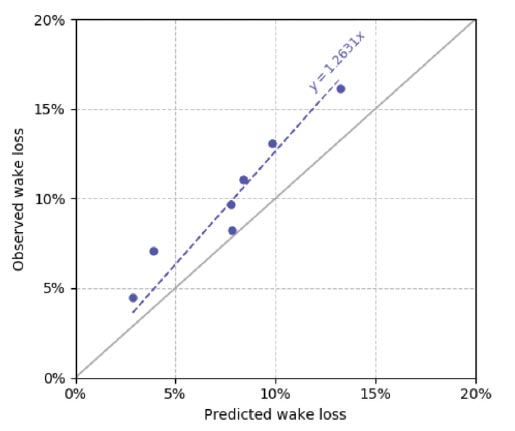
Our white paper [2] describes the methods and results of the wake loss validation study in more detail, but the key finding is illustrated in the scatter plot shown at right. We plot the model-predicted wake loss versus the observed wake loss for the seven central US wind projects, with each dot representing a full year of operations. The units of the loss factors are expressed as a percent of unwaked energy production. Perfect wake loss estimates would result in points along the gray diagonal one-to-one line. A best-fit is denoted by the dashed blue line and indicates the mean performance of the model.
We see that the most prominent finding is that our modeled wake loss is too weak compared to the observed. Modeled wake losses are around 21% weaker than observed. This deviation represents an overall bias in Vaisala’s existing wake loss estimation, which Vaisala is correcting in a method update being released this month. The good news is that the points fall fairly close to a straight line, so if the bias is removed, the remaining random error among projects is only 16% of the estimated wake loss. This is a direct estimate of the uncertainty of the wake loss estimate for projects similar to those in our validation dataset. And it is lower than the uncertainty values that the industry conventionally assigns to wake losses, which are around 20-30% of the wake loss. And when it comes to wind project financing and revenue forecasting, the uncertainty of the energy estimate is just as important as the estimate itself, so any reduction in uncertainty will have significant positive implications for project financing and future revenue.
This is a dynamic study whose sample size will grow as we seek and add more projects, and improve the diversity of the dataset with projects in other continents and climates, as well as offshore projects. With an increasing sample size, this study will further enhance our confidence in the certainty of our wake loss estimates, and will serve as a template to the industry for rigorous and consequential validation of project wake loss estimates.
References
[1] J. McCaa, J., “Wake modeling at 3TIER,” presentation at AWEA Wind Resource Assessment Workshop, 10 December 2013, Las Vegas, NV.
[2] M. Stoelinga, “A Multi-Project Validation Study of Vaisala’s Wake Loss Estimation Method,” tech. rep., Vaisala, 2019. Available here.
Add new comment