Updated solar irradiance data sets released
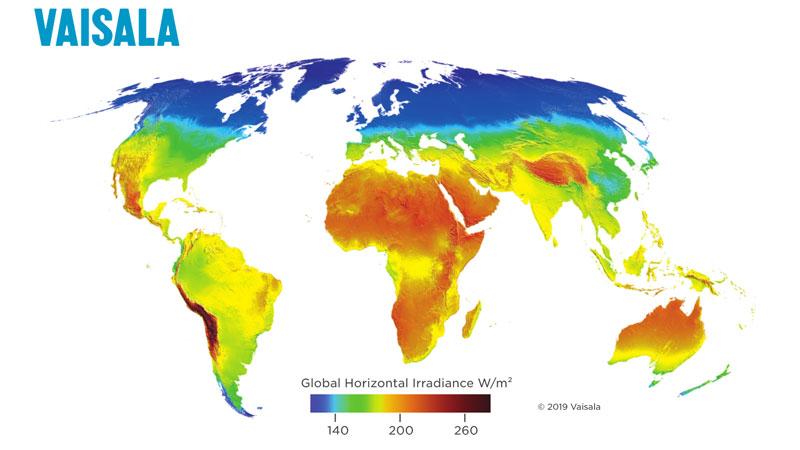
Vaisala is pleased to announce the release of updated versions of our solar irradiance data sets. 3TIER, acquired by Vaisala in 2013, has been a trusted provider of long-term solar irradiance data for over 10 years, since their creation of the first commercially available global solar irradiance data set. This data set has provided a sound basis for decision making for solar project development and financing.
As a solar irradiance data provider, Vaisala is unique in maintaining multiple satellite moels. This decision recognizes that no computational model is perfect and that the inputs to each model are characterized by uncertainties that depend on terrain type and environmental conditions, which leads to performance variations across locations. Each model version uses a clear-sky algorithm to compute the irradiance that would reach the surface if no clouds were present. These algorithms require information about the constituents of the atmosphere that scatter and absorb solar radiation. The output from the clear-sky model is then modulated by the effects of clouds, as identified from geostationary satellite imagery. In combination, these yield the solar irradiance reaching the surface.

In November 2019, new versions of the Vaisala solar irradiance data sets were released. The biggest changes affect the "1.X" (1.0, 1.1, 1.2) models, which are based on a modified Kasten clear-sky model that incorporates atmospheric aerosol and water vapor values from NASA's Moderate Resolution Imaging Spectroradiometer (MODIS) instruments. The MODIS instruments are part of the payload on two polar orbiting satellites launched in 2000 and 2002. The MODIS instrument team constantly refines its data processing algorithms and recently released Collection (version) 6.1 of its products, in which their latest algorithms have been applied retrospectively to all data collected by the MODIS instruments.
We incorporated the new MODIS aerosol and water vapor products into our 1.X models and released new versions of the resulting data sets in November 2019. Since that time, the new 1.X data sets have been made available through our online Time Series Tool and employed in our resource assessments. Two additional changes were included in our update: the latest MODIS data have replaced a temporary climatology used for the years 2017-2018 in the 1.X models and the values of two parameters that describe the radiative properties of aerosols were modified in the 2.X (2.0 and 2.1) model versions. All of these changes improve the representation of aerosols, which strongly affect the transmission of solar radiation through the atmosphere.
A validation study of global horizontal irradiance (GHI) from the updated data sets was performed via comparisons to observations from 11 high-quality solar monitoring stations throughout the United States. These observational data were supplied by a Vaisala client specifically for use in this exercise. The observational data were first quality controlled to bankable data standards. The table below presents statistical results from these comparisons in terms of percent. The mean of the mean bias error (MBE) at all of the sites is 2% or less for each model. The uncertainty, as estimated by the standard deviation of the MBE over all the sites, ranges from 1.1% to 1.5%. These standard deviation values correspond to an average 95% confidence limit of 2.65%. This demonstrates outstanding performance for the updated data sets, maintaining Vaisala’s standing as an industry-leading provider of satellite-based solar irradiance data for project planning and site assessment.
Table 1: Global horizontal irradiance (GHI) mean bias error (MBE) at each of the 11 stations indexed by state and Vaisala model version. Summary statistics (mean MBE, standard deviation of the MBE, and 95% confidence limit) are in the subsection below. All values are in percent.
State | Vaisala 1.0 | Vaisala 1.1 | Vaisala 1.2 | Vaisala 2.0 | Vaisala 2.1 |
AL | 0.5 | 1.4 | 0.9 | 1.7 | 2.8 |
CA | -1.4 | -1.3 | -1.3 | 4.1 | 2.2 |
CA | -0.8 | -0.8 | -0.9 | 3.6 | 3.8 |
GA | 1.2 | 1.7 | 0.7 | 1.7 | 2.6 |
GA | 0.6 | 0.8 | 0.0 | 1.0 | 1.9 |
GA | 0.0 | 0.7 | -0.4 | 1.0 | 1.9 |
MD | -3.5 | -2.5 | -2.6 | 1.0 | 1.7 |
NY | -1.9 | -1.0 | -1.5 | 2.6 | 2.8 |
TN | -1.9 | -1.0 | -1.4 | 0.7 | 2.1 |
TX | -2.2 | -2.4 | -2.1 | -1.2 | -0.7 |
TX | 0.8 | -0.2 | -0.1 | 0.8 | 1.4 |
|
|
|
|
|
|
Mean MBE | -0.8 | -0.4 | -0.8 | 1.5 | 2.0 |
StDev MBE | 1.5 | 1.4 | 1.1 | 1.5 | 1.1 |
95% limit | 3.0 | 2.8 | 2.2 | 2.9 | 2.2 |
The Author, Laura Hinkelman is a Solar Energy Assessment Analyst at Vaisala

Add new comment