National Lightning Detection Network

The most accurate and dependable lightning network in the continental U.S. has provided robust and comprehensive lightning data for more than 40 years.

Robust & accurate

United States lightning density map

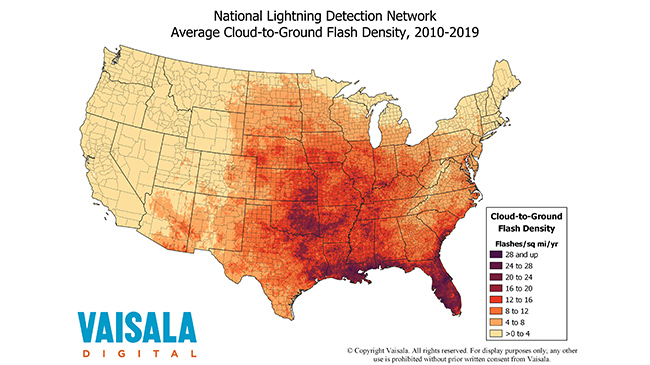
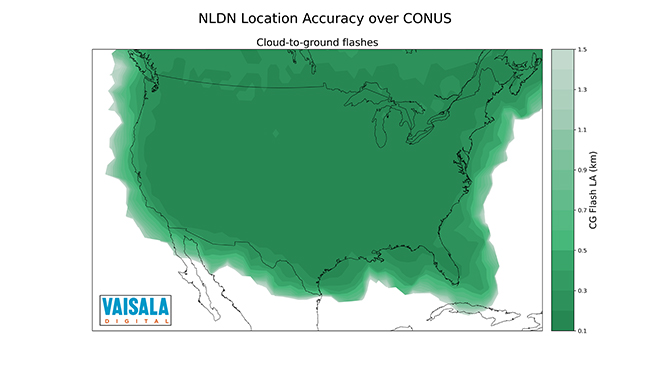
The Vaisala National Lightning Detection Network (NLDN) detects more real-time lightning events than any other network with unrivaled location accuracy and detection efficiency that covers the contiguous United States (CONUS). It even delineates cloud-to-cloud and cloud-to-ground strikes for more accurate alert planning, lightning reporting, and damage investigation.

Equipped with best-in-class information about the location, time, and type of lightning, organizations can make better decisions to safeguard personnel, protect assets, deploy resources, and minimize downtime.

Around the clock

With better than 99.99% uptime, Vaisala NLDN monitors storm activity 24 hours a day, 7 days a week, 365 days a year. The data feed runs with about 12-second latency and is delivered over a variety of real-time methods, file types, and APIs to fit your forecasting, alert generation, lighting reporting, and analytical needs. Historical lightning data can also be easily accessed and analyzed.

Comprehensive data

NDLN provides a wealth of significant lighting data on individual strikes including cloud-to-ground stroke or in-cloud pulse designation, location, duration polarity, and peak current. It delivers the real-time data required for early alerts, lightning reports, and accurate risk modeling. You can also access historical data to enable policy planning and incident investigations. You’ll have the precise data you need without having to install or maintain a single sensor of your own.

Earlier detection

The real-time coverage of storm systems across the U.S. will let you know about potential severe thunderstorms sooner. Watch storm behavior and create more accurate models to determine your best course of action for limiting operational downtime while still looking out for those who trust you to keep them safe.

How to access lightning data from the NLDN

Map showing real-time lightning data from the Xweather API

Xweather API

Direct access to the world's most accurate real-time and historical lightning data to integrate into your applications, systems, and processes.
Map showing lightning activity near Miami International Airport

Xweather Protect

Improve operational safety and continuity with real-time lightning detection and severe weather alerts for all your locations worldwide.
Teamworking

Talk to an expert

Contact our industry experts to see Vaisala’s real-time and historical lightning data, software solutions, or receive lightning alerts near you, anywhere in the world. We’re here to help!

Resources

Annual Lightning Report 2024 cover
Report

Annual Lightning Report

How does lightning affect the world’s busiest airports? Where are U.S. wind farms most at risk from lightning? Which town is the U.S. lightning capital? Find the answers and more in the 2024 Vaisala Xweather Annual Lightning Report.
Global lightning map
Interactive map

Global lightning density map

See where lightning strikes with the Vaisala Xweather global lightning density map. Compare the average number of lightning events per km2 per year for every country then zoom in to see how much lightning occurs in your state or province.
Lightning density map
Blog

Lightning safety

Lightning is a serious safety hazard that can cause injuries or even death. Discover proven strategies, solutions, and industry insights to safeguard your operations and create a more resilient workplace.
E-mail Facebook Twitter LinkedIn